Fig. 3
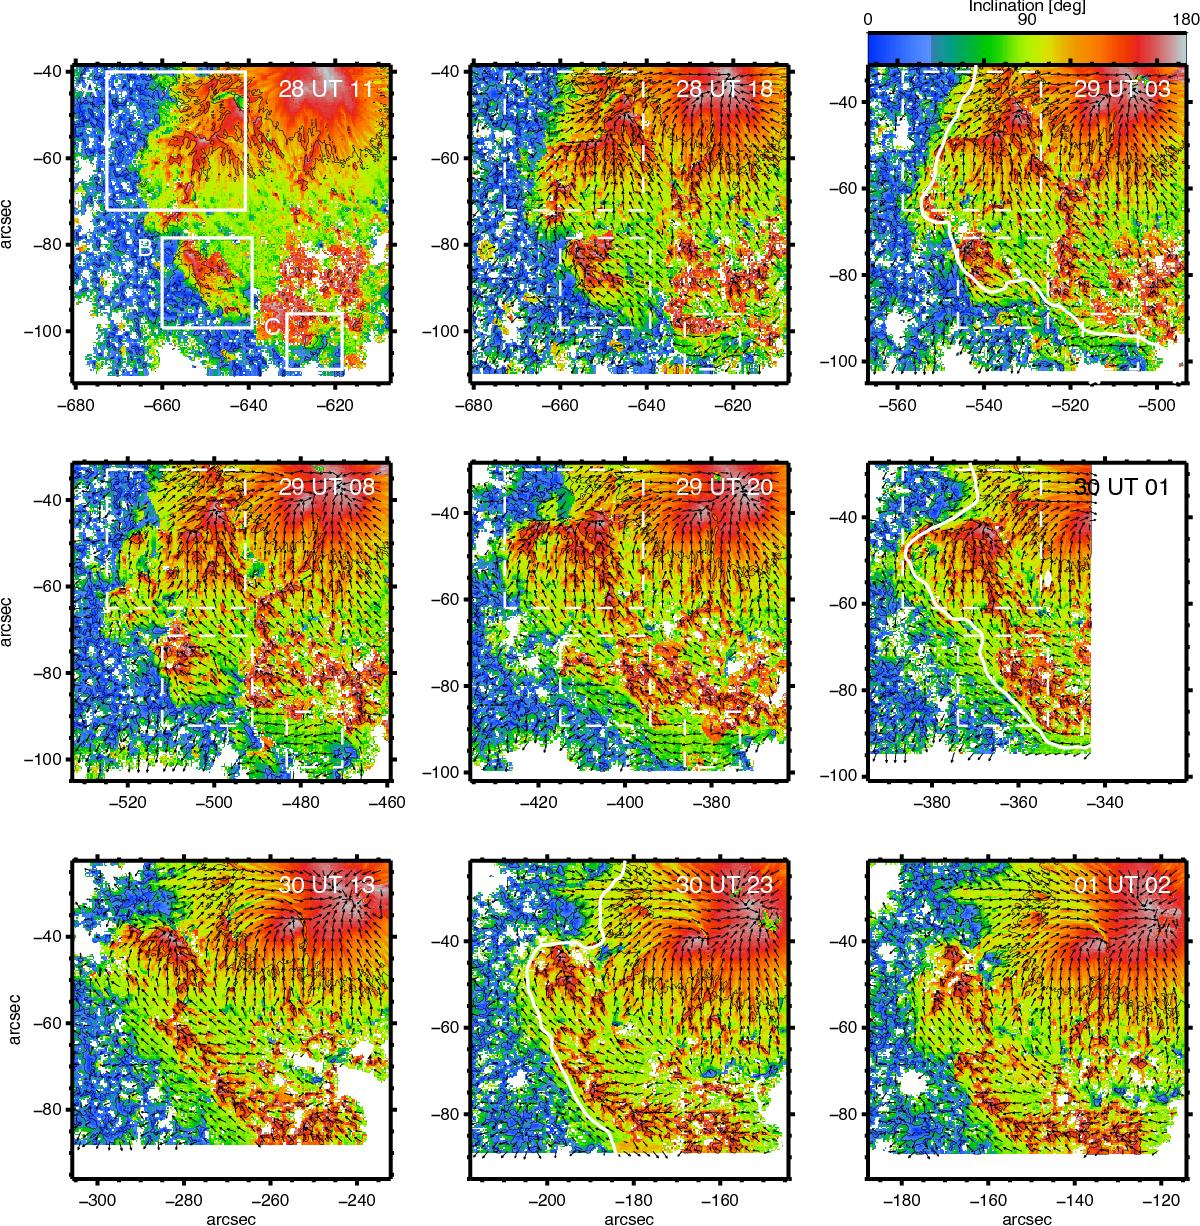
LOS inclinations at log (τ) = −2 of four SOT/SP scans. The black contour lines indicate kG magnetic fields at log (τ) = −0.8. The colour bar applies to all panels, where blue represents positive polarity fields and red the negative polarity. The arrows indicate the direction of the azimuthal magnetic field component at log (τ) = −2 and the white line follows the PIL. The xy axes indicate the distance to disc centre. The three white boxes are identical to those in Fig. 1.
Current usage metrics show cumulative count of Article Views (full-text article views including HTML views, PDF and ePub downloads, according to the available data) and Abstracts Views on Vision4Press platform.
Data correspond to usage on the plateform after 2015. The current usage metrics is available 48-96 hours after online publication and is updated daily on week days.
Initial download of the metrics may take a while.