Fig. 2
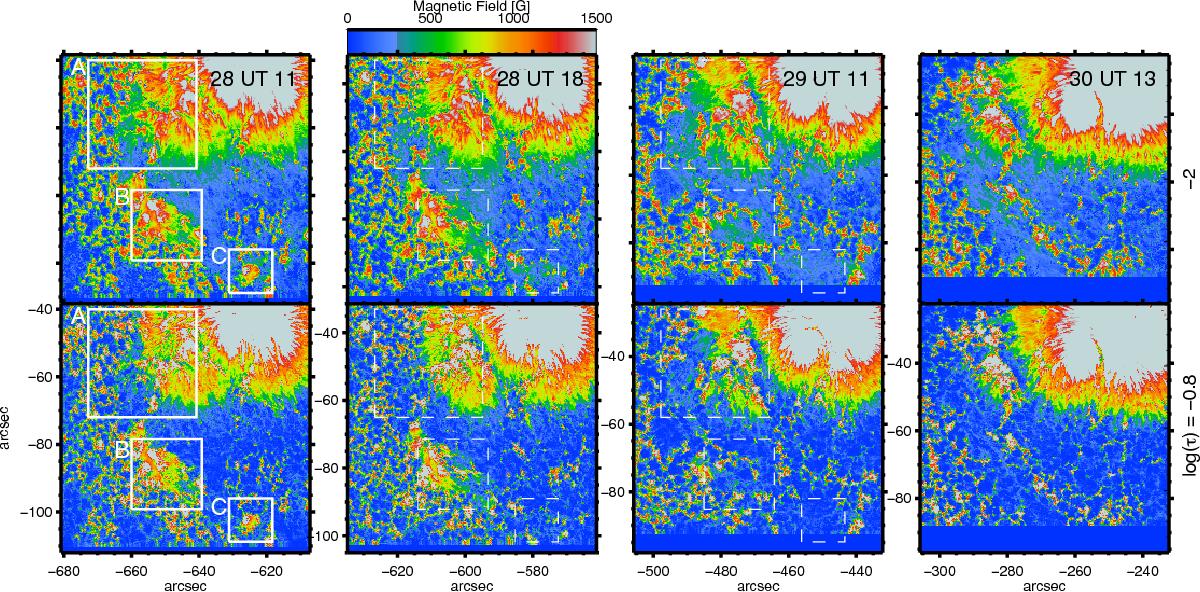
Magnetic field strengths obtained from the inversions. Each column corresponds to a separate SOT/SP scan, and the upper and lower rows indicate the field strengths at log (τ) = −2 and –0.8 respectively. The colour bar applies to all plots and the xy axes indicate the distance to disc centre. The three white boxes are identical to those in Fig. 1.
Current usage metrics show cumulative count of Article Views (full-text article views including HTML views, PDF and ePub downloads, according to the available data) and Abstracts Views on Vision4Press platform.
Data correspond to usage on the plateform after 2015. The current usage metrics is available 48-96 hours after online publication and is updated daily on week days.
Initial download of the metrics may take a while.