Free Access
Fig. 1
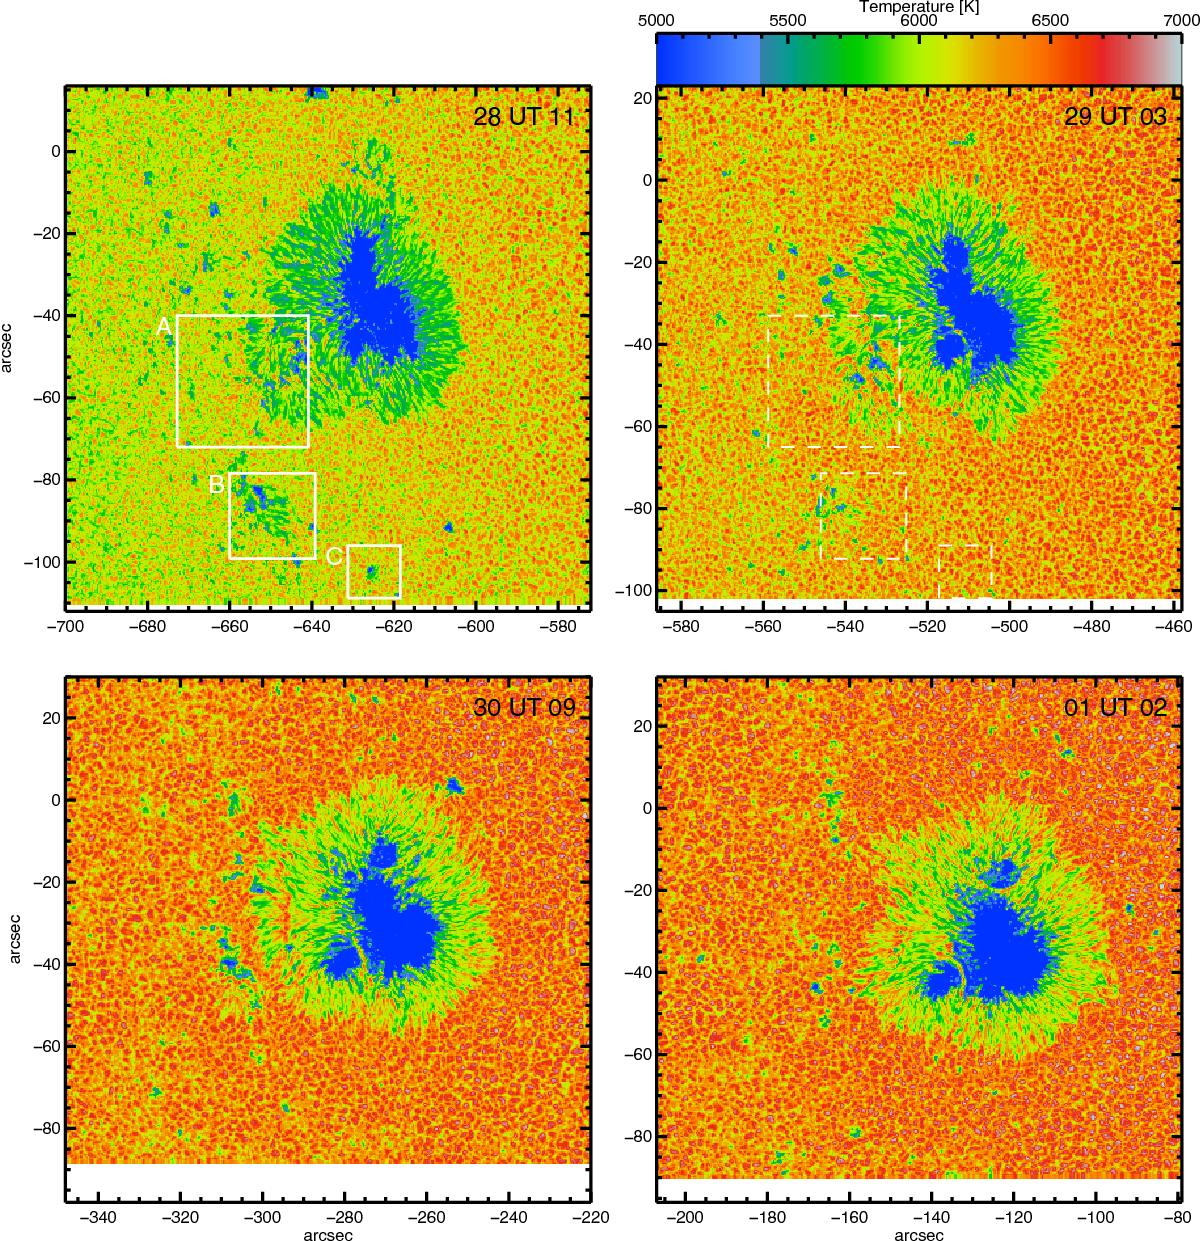
Temperatures at log (τ) = 0 from the inversion of four SOT/SP scans. The colour bar applies to all plots. The xy axes indicate the distance to disc centre. The three boxes marked A, B and C enclose regions of rising flux.
Current usage metrics show cumulative count of Article Views (full-text article views including HTML views, PDF and ePub downloads, according to the available data) and Abstracts Views on Vision4Press platform.
Data correspond to usage on the plateform after 2015. The current usage metrics is available 48-96 hours after online publication and is updated daily on week days.
Initial download of the metrics may take a while.