Fig. 2
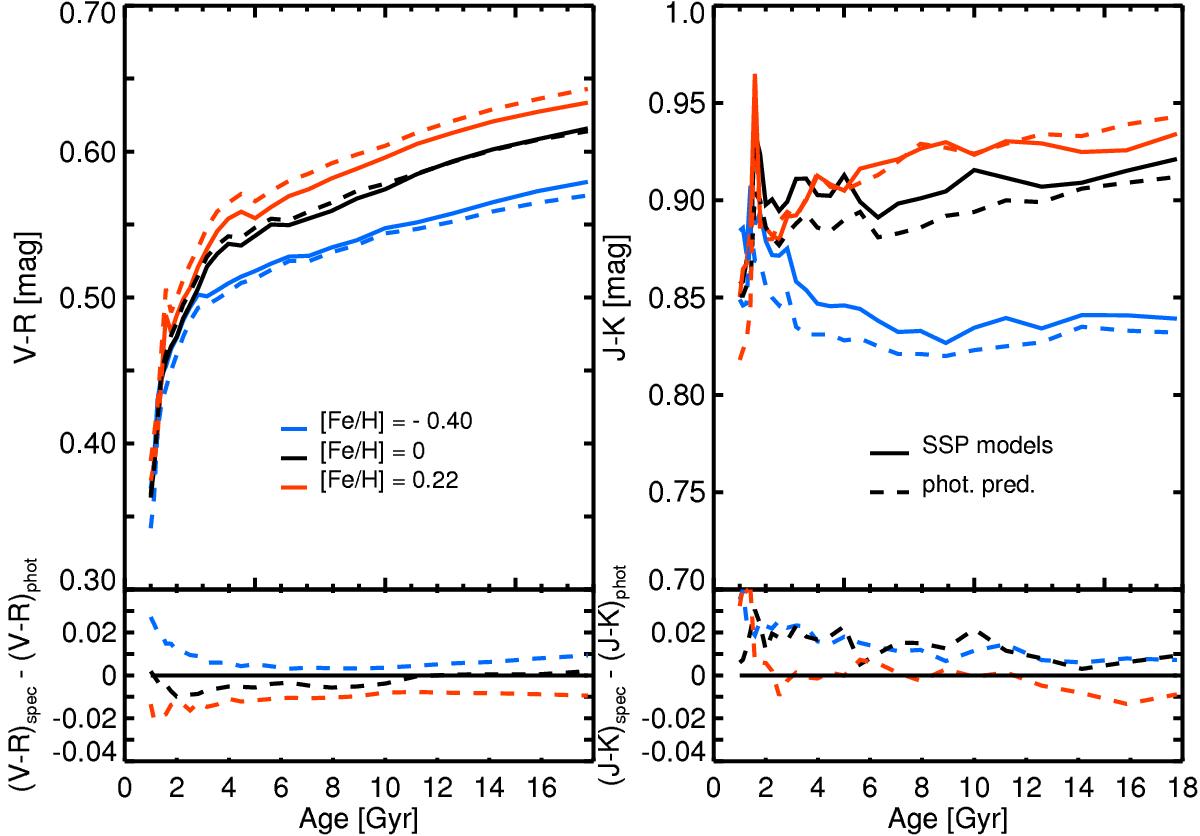
Upper panels: comparison between the behaviour with age of the (V − R) and the (J − K) colours extracted from our model spectra (based on Padova00 isochrones) and the same colours from the MILES photometric predictions (see http://miles.iac.es; Vazdekis et al. 2010, 2015). The dotted lines delineate the MILES photometric predictions and the solid ones the colours calculated from our SSP model spectra. The different colours and symbols represent three different metallicites (see legend). Lower panels: visualization of the absolute differences between the colours measured from our model spectra and the photometrically predicted ones.
Current usage metrics show cumulative count of Article Views (full-text article views including HTML views, PDF and ePub downloads, according to the available data) and Abstracts Views on Vision4Press platform.
Data correspond to usage on the plateform after 2015. The current usage metrics is available 48-96 hours after online publication and is updated daily on week days.
Initial download of the metrics may take a while.