Fig. 10
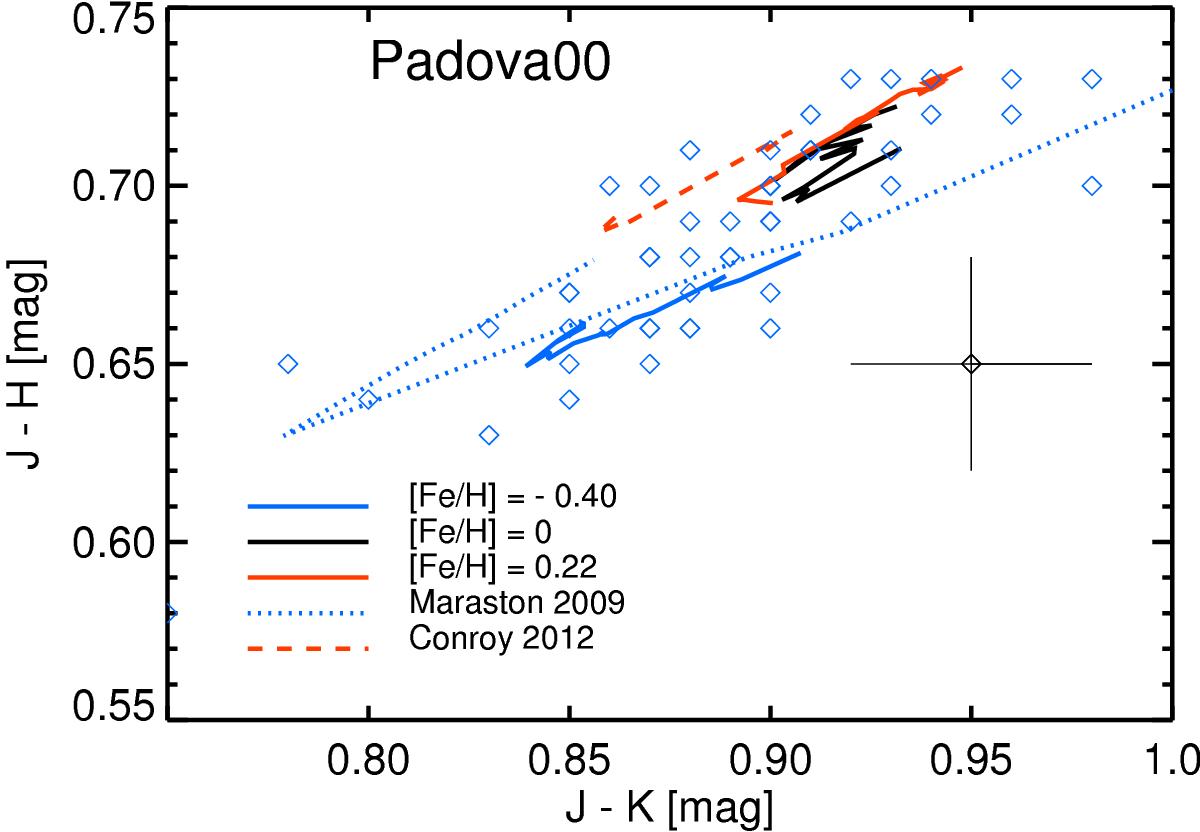
(J − H) versus (J − K) diagram of the ETGs of Frogel et al. (1978; blue diamonds). Overplotted are the corresponding colours predicted from our SSP models based on Padova00 isochrones (solid lines, colours indicate different metallicities according to the legend) as well as those originating from the Maraston models (blue dotted line) and from the CvD models (red dashed line). Both of these sets of models were computed for Solar metallicity and for ages larger than 1 Gyr (Maraston models) and 3 Gyr (CvD models), respectively. The observed uncertainties in both colours are indicated by an error bar.
Current usage metrics show cumulative count of Article Views (full-text article views including HTML views, PDF and ePub downloads, according to the available data) and Abstracts Views on Vision4Press platform.
Data correspond to usage on the plateform after 2015. The current usage metrics is available 48-96 hours after online publication and is updated daily on week days.
Initial download of the metrics may take a while.