Free Access
Fig. 8
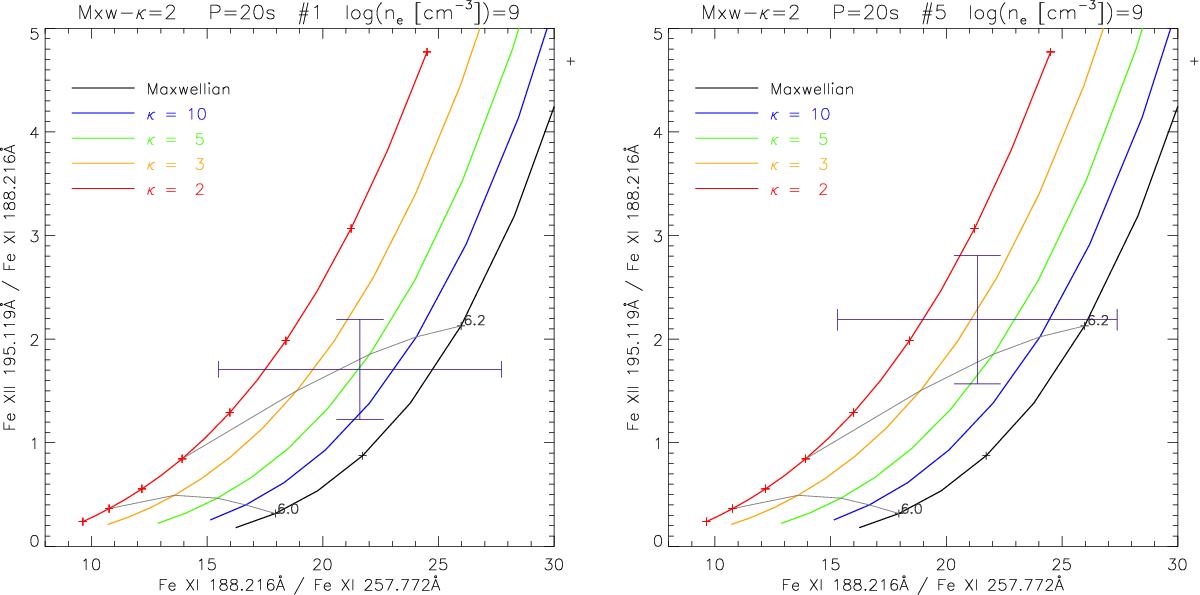
Attempted diagnostics of a stationary κ-distribution using the period-averaged spectra for the first period (left) and the fifth period (right). Individual colors stand for different values of the stationary κ-distribution, while the violet cross represents the line intensity ratios with their assumed uncertainties.
This figure is made of several images, please see below:
Current usage metrics show cumulative count of Article Views (full-text article views including HTML views, PDF and ePub downloads, according to the available data) and Abstracts Views on Vision4Press platform.
Data correspond to usage on the plateform after 2015. The current usage metrics is available 48-96 hours after online publication and is updated daily on week days.
Initial download of the metrics may take a while.