Free Access
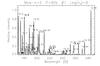
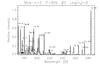
Fig. 3
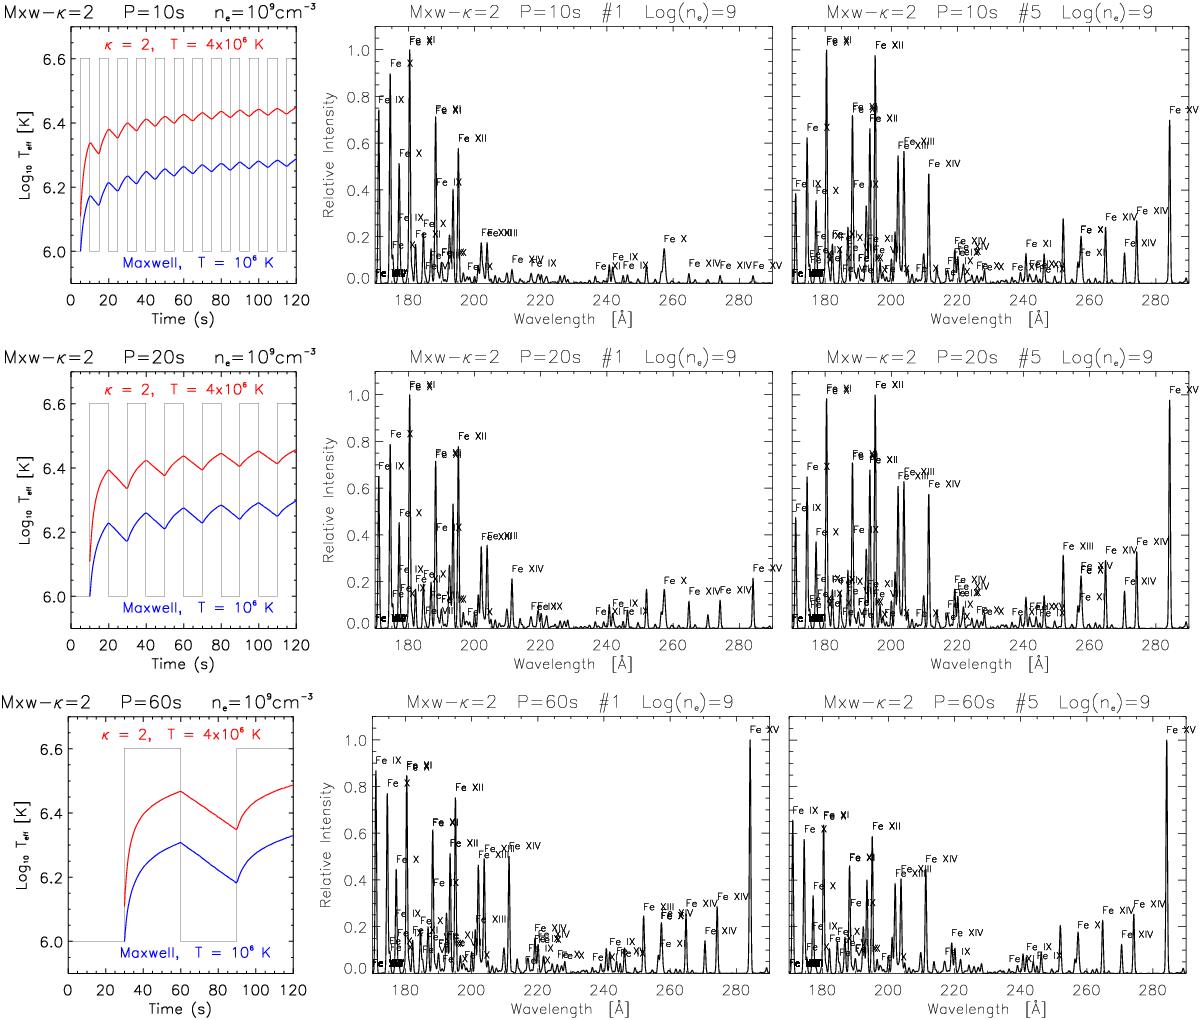
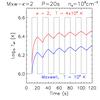
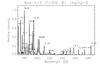
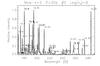
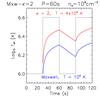
Evolution of the effective ionization temperature (left) and the corresponding EUV spectra during the first (center) and fifth period (right). Individual rows stand for different periods. The assumed electron density is log(ne [cm-3]) = 9. Instantaneous spectra at each time step in the calculation are shown in Movies 1–3.
This figure is made of several images, please see below:
Current usage metrics show cumulative count of Article Views (full-text article views including HTML views, PDF and ePub downloads, according to the available data) and Abstracts Views on Vision4Press platform.
Data correspond to usage on the plateform after 2015. The current usage metrics is available 48-96 hours after online publication and is updated daily on week days.
Initial download of the metrics may take a while.