Fig. 9
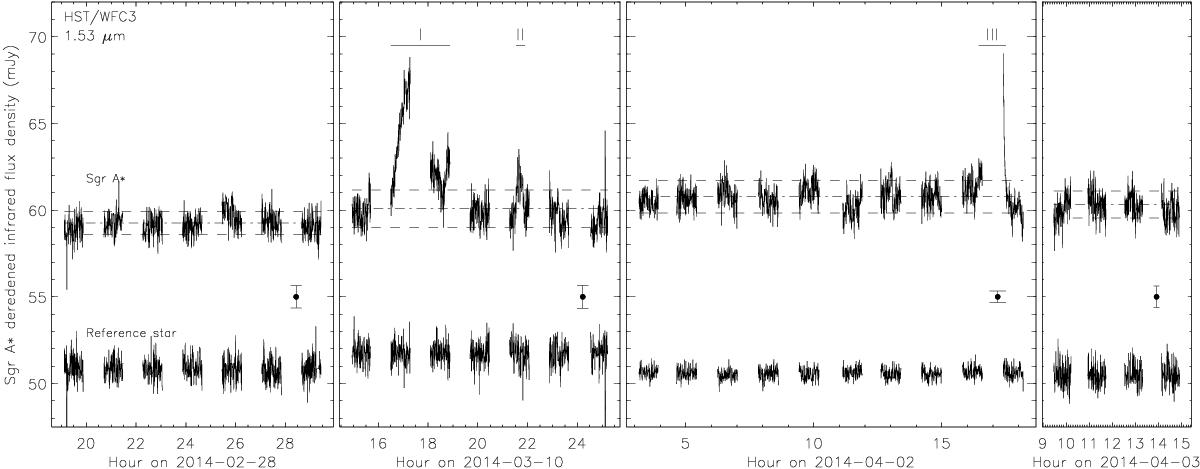
Light curves of Sgr A* obtained with WFC3 on board HST during 2014 Feb.−Apr. The NIR flares are labeled with Roman numerals. The horizontal lines below these labels indicate the flare durations. The error bar in each panel is standard deviation of the photometry.
Current usage metrics show cumulative count of Article Views (full-text article views including HTML views, PDF and ePub downloads, according to the available data) and Abstracts Views on Vision4Press platform.
Data correspond to usage on the plateform after 2015. The current usage metrics is available 48-96 hours after online publication and is updated daily on week days.
Initial download of the metrics may take a while.