Fig. 8
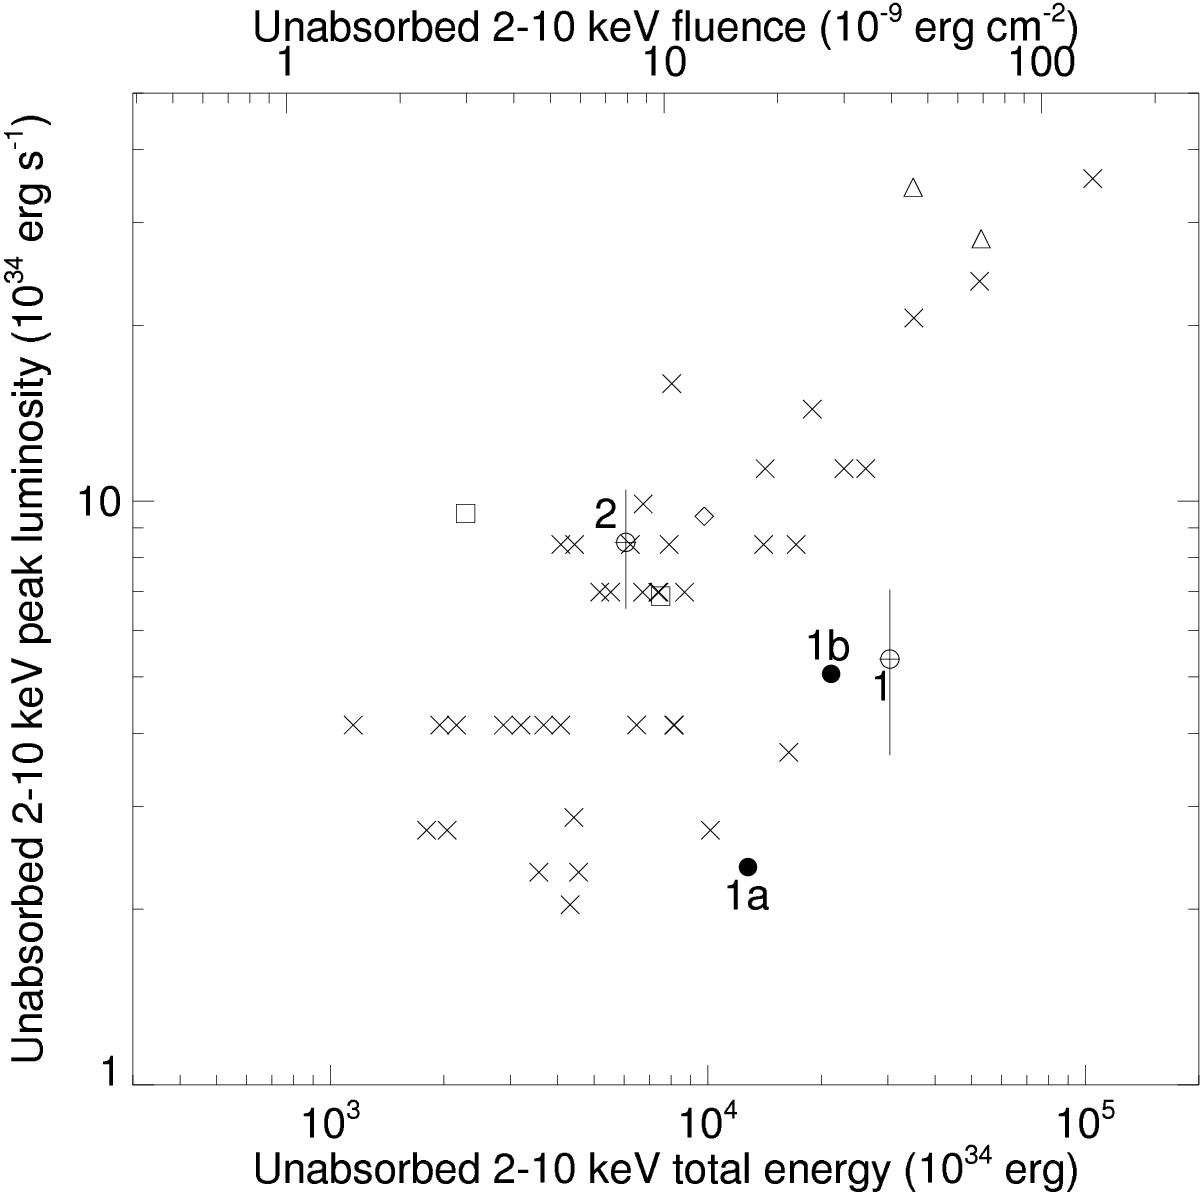
Unabsorbed total energy vs. unabsorbed peak luminosity of the X-ray flares (adapted from Mossoux et al. 2015a). The top x-axis is the unabsorbed fluence. The crosses represent the X-ray flares from the Chandra XVP campaign (Neilsen et al. 2013), the triangles are the two brightest flares seen with XMM-Newton (Porquet et al. 2003, 2008), the diamond and the two squares are the 2011 March 30 flare and its subflares, respectively (Mossoux et al. 2015a). The empty circles are X-ray flares 1 and 2 of this work with their 1σ error bars. The filled circles are the components 1a and 1b of flare 1 (see Sect. 4.1.2).
Current usage metrics show cumulative count of Article Views (full-text article views including HTML views, PDF and ePub downloads, according to the available data) and Abstracts Views on Vision4Press platform.
Data correspond to usage on the plateform after 2015. The current usage metrics is available 48-96 hours after online publication and is updated daily on week days.
Initial download of the metrics may take a while.