Fig. 6
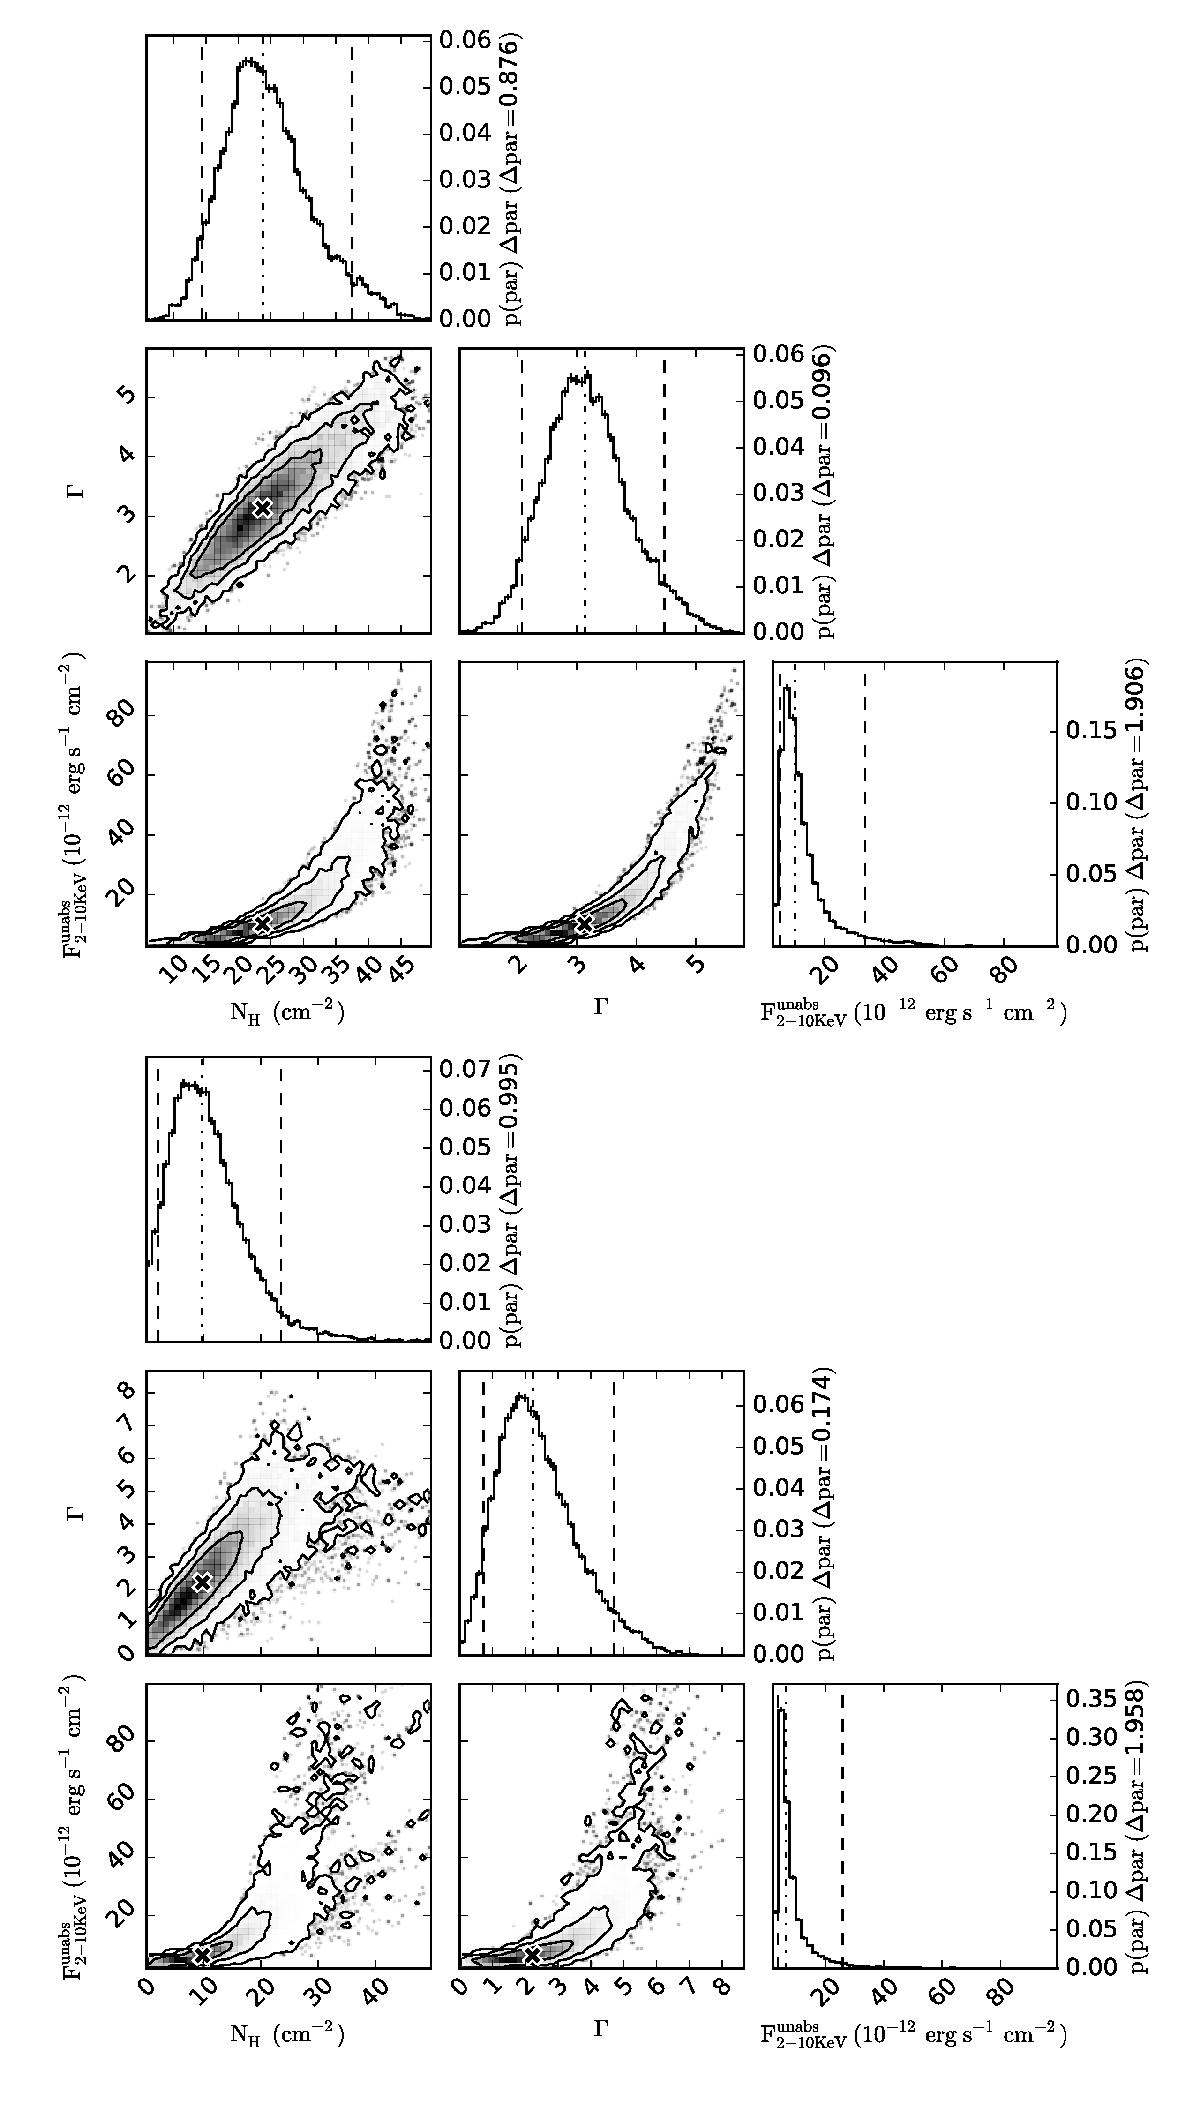
Best-fit parameters of the 2014 Mar. 10 (top) and 2014 Apr. 2 (bottom) flares. The diagonal plots are the marginal density distribution of each parameter. The median values of each parameter are represented by the vertical dotted lines in diagonal plots and by a cross in other panels; the vertical dashed lines define the 90% confidence interval (see Table 7 for the exact values). The contours are 68%, 90% and 99% of confidence levels.
Current usage metrics show cumulative count of Article Views (full-text article views including HTML views, PDF and ePub downloads, according to the available data) and Abstracts Views on Vision4Press platform.
Data correspond to usage on the plateform after 2015. The current usage metrics is available 48-96 hours after online publication and is updated daily on week days.
Initial download of the metrics may take a while.