Fig. 5
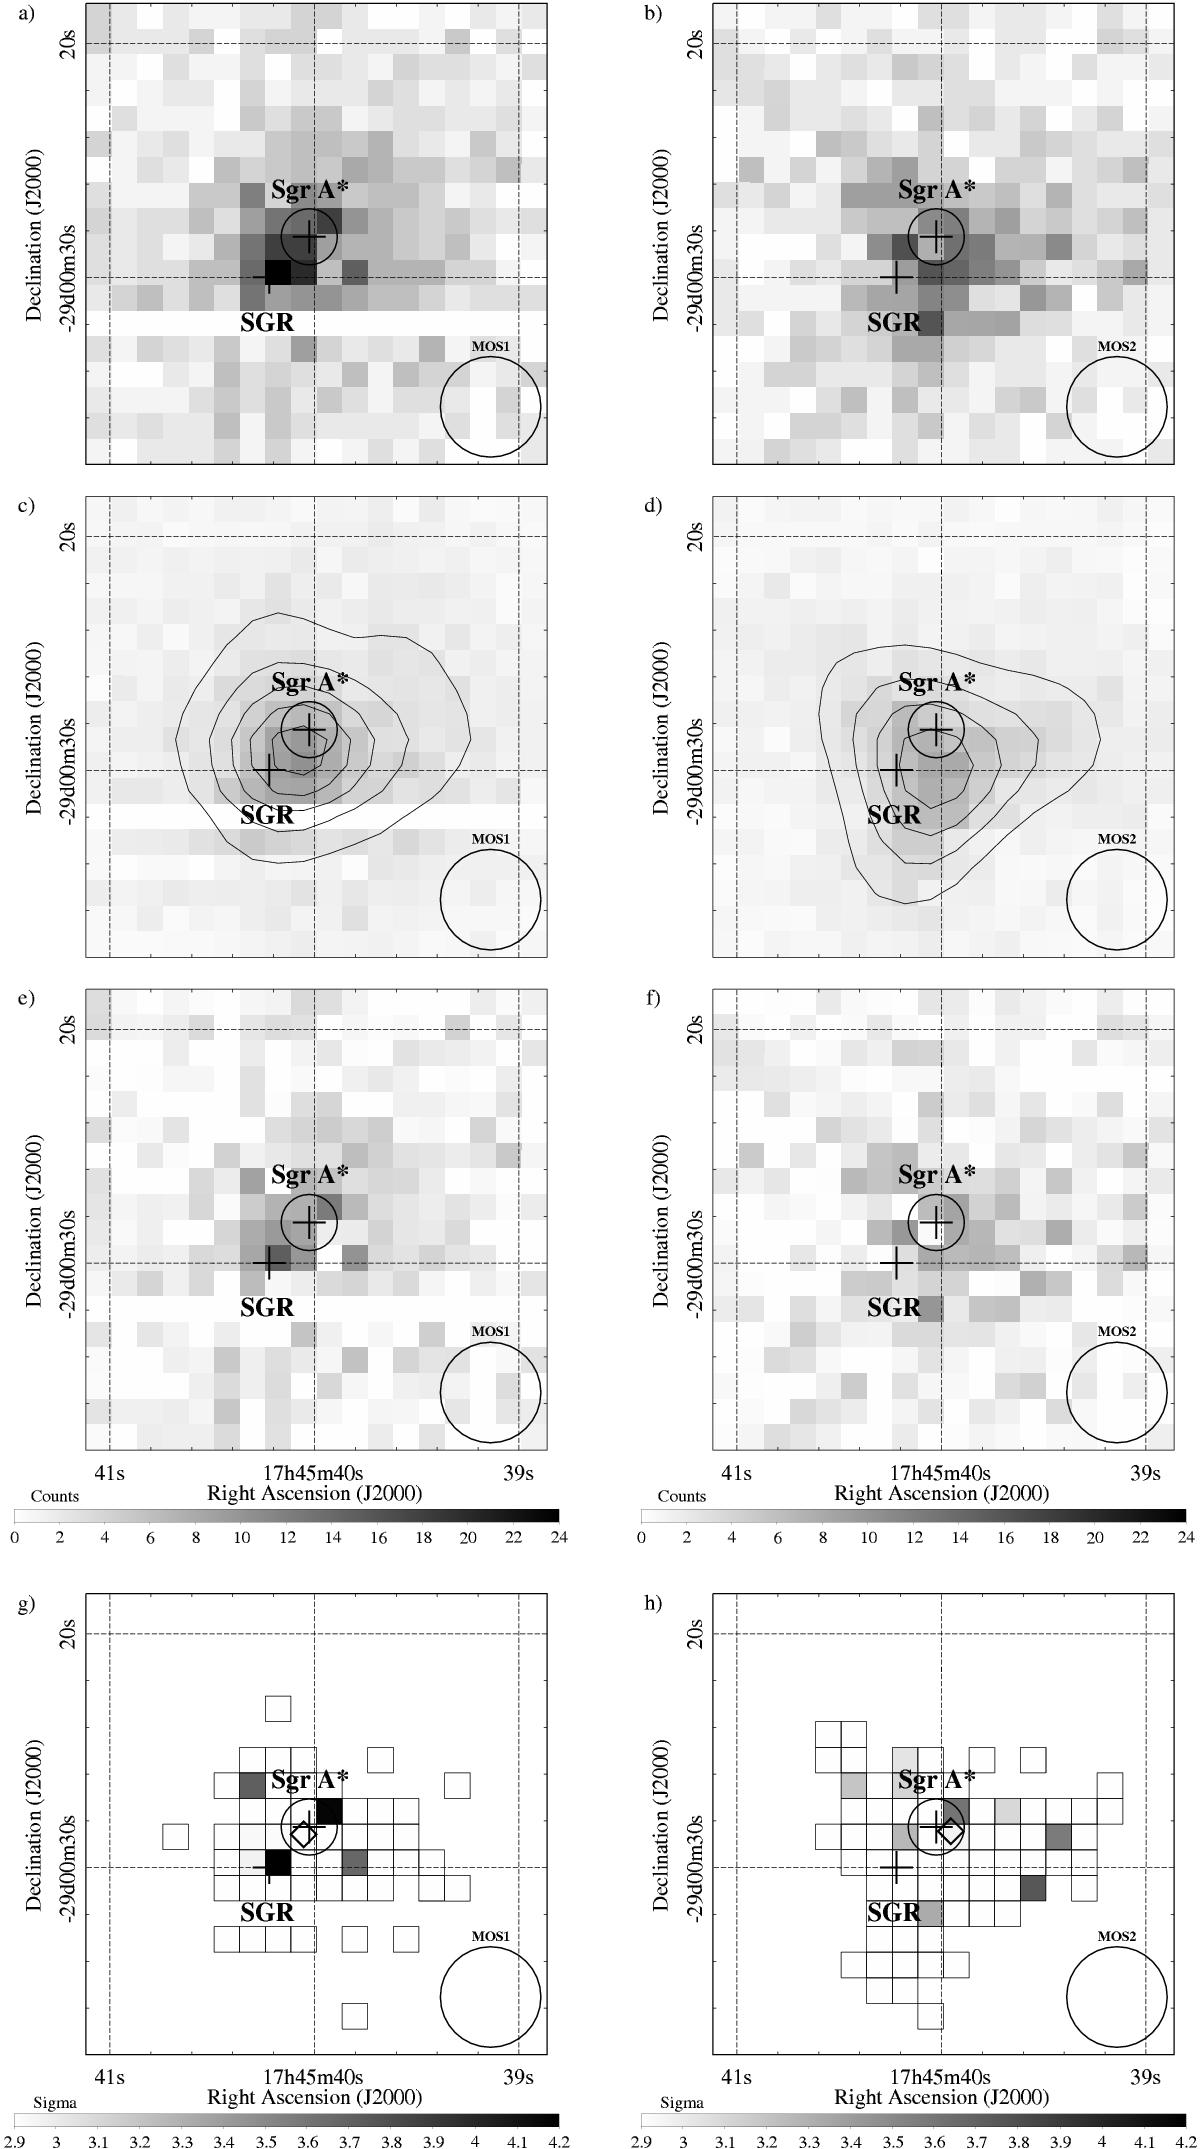
XMM-Newton/MOS1 (left column) and MOS2
(right column) images of Sgr A* on 2014 Mar. 10. The energy range
is 2–10 keV. The field of view is 20″ ×
20″, the pixel size is ![]() . The same linear color-scale is
used for panels a)–f) and
g)–h). In all panels, the black circle in the
right-bottom corner is the instrument angular-resolution (FWHM); the crosses are
the positions of SGR J1745-2900 (Bower et al.
2015b) and Sgr A* (Petrov et al. 2011),
surrounded by a circle giving the absolute-astrometry uncertainty of EPIC
(
. The same linear color-scale is
used for panels a)–f) and
g)–h). In all panels, the black circle in the
right-bottom corner is the instrument angular-resolution (FWHM); the crosses are
the positions of SGR J1745-2900 (Bower et al.
2015b) and Sgr A* (Petrov et al. 2011),
surrounded by a circle giving the absolute-astrometry uncertainty of EPIC
(![]() ; Guainazzi 2013). Panels a) and b):
count numbers observed during the flaring period. Panels c) and
d): count numbers observed during the non-flaring period
scaled-down to the flaring-period exposure. The contour map shows count numbers
smoothed on four pixels with a Gaussian, starting from 2 counts with step of 1
count. Panels e) and f): count excesses during the
flaring period. Panels g) and h): statistically
significant count excesses (≥
3σ; computed on the boxed-pixel area with
the Bayesian method of Kraft et al. 1991),
the diamond is the corresponding count-weighted barycenter of these detections.
; Guainazzi 2013). Panels a) and b):
count numbers observed during the flaring period. Panels c) and
d): count numbers observed during the non-flaring period
scaled-down to the flaring-period exposure. The contour map shows count numbers
smoothed on four pixels with a Gaussian, starting from 2 counts with step of 1
count. Panels e) and f): count excesses during the
flaring period. Panels g) and h): statistically
significant count excesses (≥
3σ; computed on the boxed-pixel area with
the Bayesian method of Kraft et al. 1991),
the diamond is the corresponding count-weighted barycenter of these detections.
Current usage metrics show cumulative count of Article Views (full-text article views including HTML views, PDF and ePub downloads, according to the available data) and Abstracts Views on Vision4Press platform.
Data correspond to usage on the plateform after 2015. The current usage metrics is available 48-96 hours after online publication and is updated daily on week days.
Initial download of the metrics may take a while.