Fig. A.2
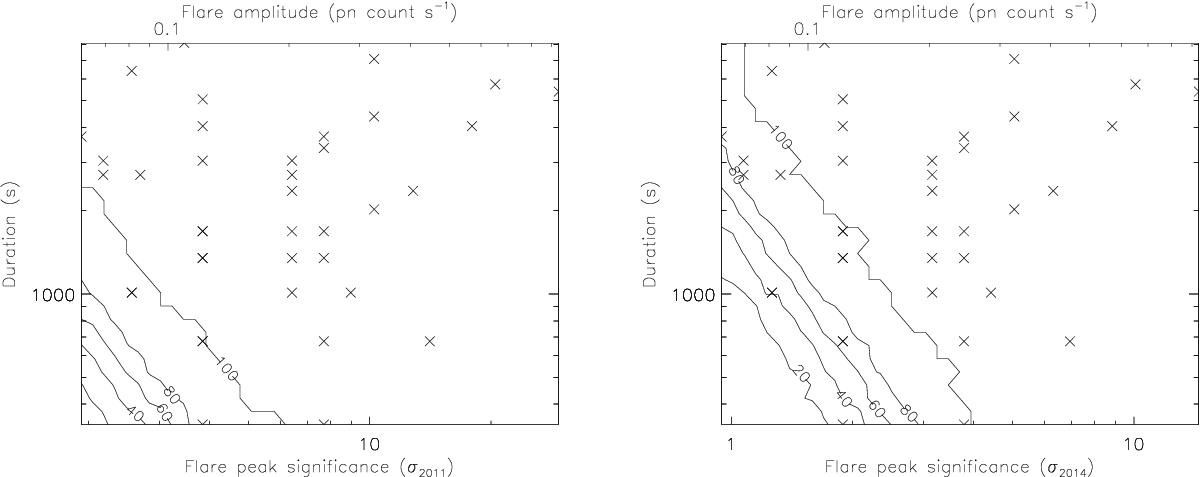
Flare distribution seen by Chandra and the detection probability of the Bayesian-blocks algorithm during an observation with XMM-Newton. The crosses are the X-ray flares detected during the Chandra XVP campaign of 2012. Left panel: the flare amplitude above the non-flaring level seen by EPIC/pn during the 2011 campaign. Right panel: the flare amplitude above the non-flaring level seen by EPIC/pn during the 2014 Feb. 28 observation.
Current usage metrics show cumulative count of Article Views (full-text article views including HTML views, PDF and ePub downloads, according to the available data) and Abstracts Views on Vision4Press platform.
Data correspond to usage on the plateform after 2015. The current usage metrics is available 48-96 hours after online publication and is updated daily on week days.
Initial download of the metrics may take a while.