Fig. A.1
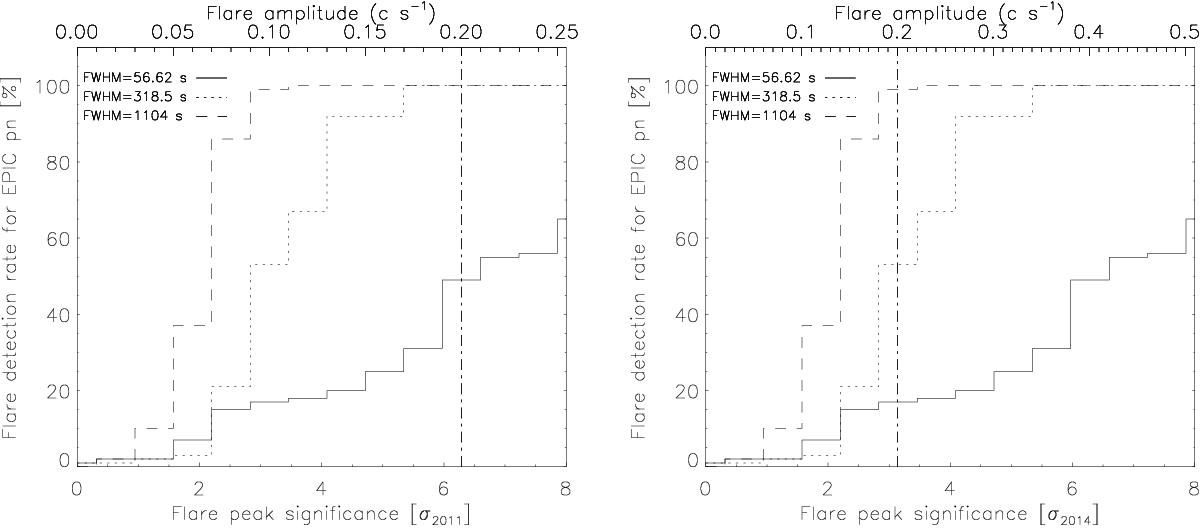
Comparison of the flare detection level with the non-flaring level corresponding to those of the 2011 (left panel) and February 2014 (right panel) observations. The vertical doted-dashed line represents an example flare with the same amplitude above the non-flaring level for a 2011 and 2014 Feb.−Apr. observations.
Current usage metrics show cumulative count of Article Views (full-text article views including HTML views, PDF and ePub downloads, according to the available data) and Abstracts Views on Vision4Press platform.
Data correspond to usage on the plateform after 2015. The current usage metrics is available 48-96 hours after online publication and is updated daily on week days.
Initial download of the metrics may take a while.