Fig. 19
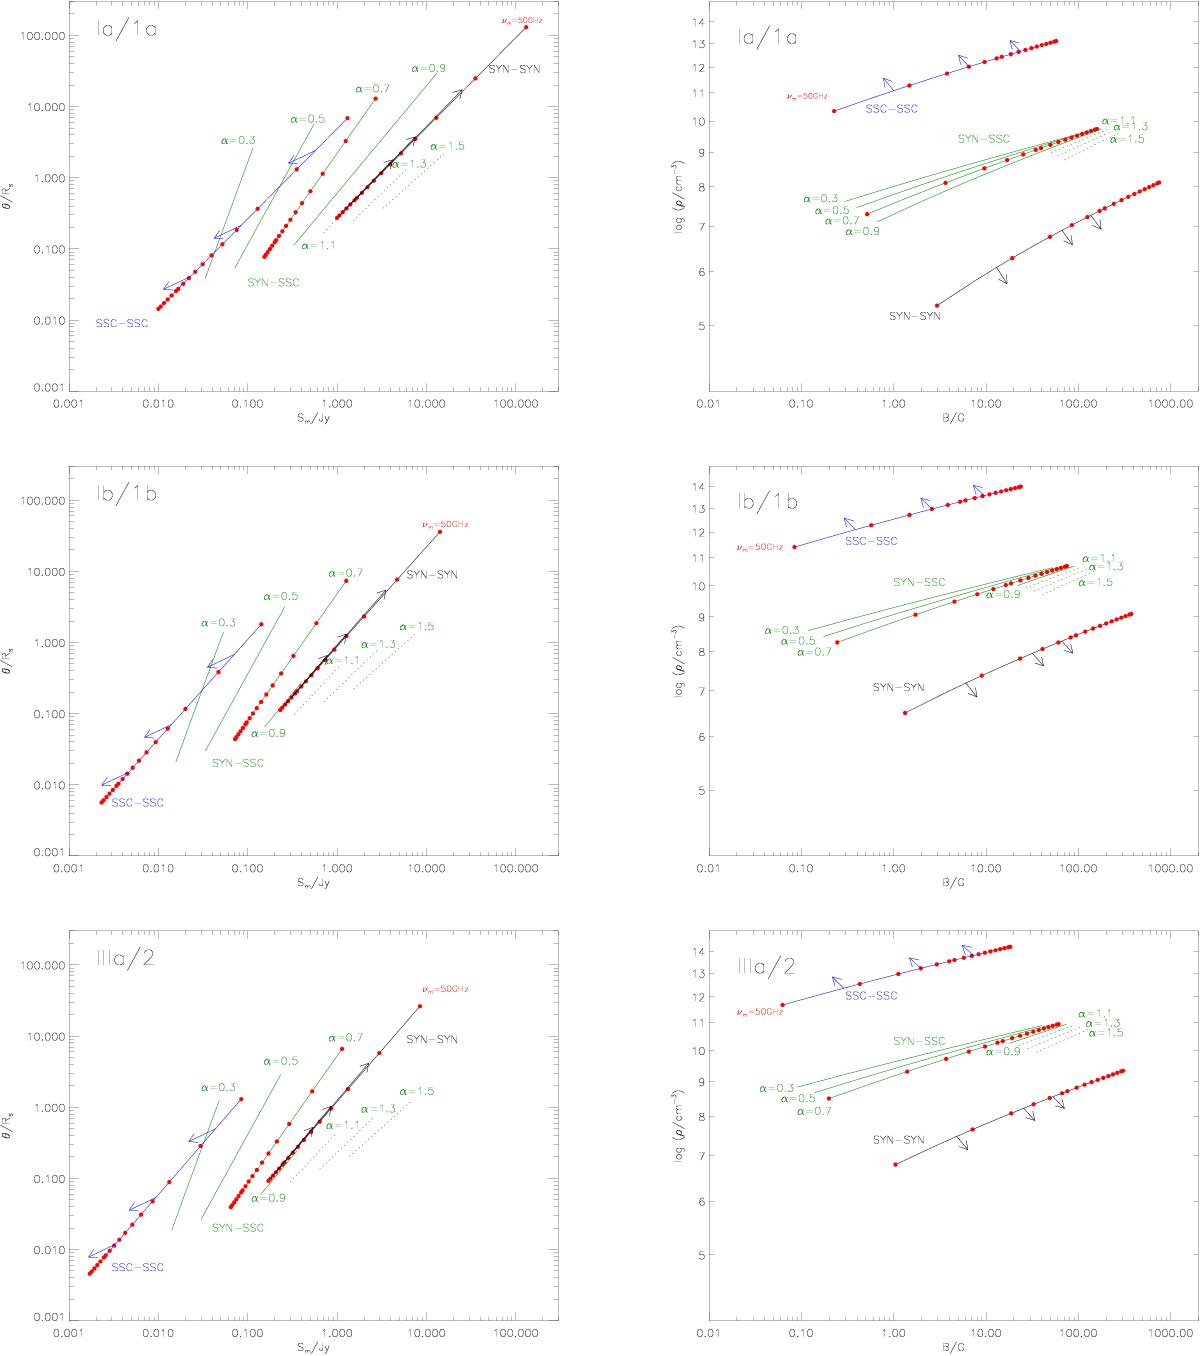
Physical parameters of the flares observed simultaneously in X-rays and NIR for the three emission models. The flare Ia/1a, Ib/1b and IIIa/2 are in the upper, middle and bottom panels, respectively. Left panels are the size of the flaring-source region (θ) vs. the peak of the spectrum (Sm) at the frequency νm. Right panels are the density of the relativistic electrons vs. the magnetic field. The locii where the Synchrotron Self-Compton−Synchrotron Self-Compton (SSC-SSC), Synchrotron-Synchrotron Self-Compton (SYN-SSC) and Synchrotron-Synchrotron (SYN-SYN) are dominant are shown in black, blue and green, respectively. The red dots represent the turnover frequencies from 50 to 3000 GHz by step of 200 GHz. The arrows show the direction of the curves if the limit on the alternative emission processes is lowered. Dotted lines are locii of SYN-SSC where the MIR emission is larger than the observed upper-limit values (see text for details).
Current usage metrics show cumulative count of Article Views (full-text article views including HTML views, PDF and ePub downloads, according to the available data) and Abstracts Views on Vision4Press platform.
Data correspond to usage on the plateform after 2015. The current usage metrics is available 48-96 hours after online publication and is updated daily on week days.
Initial download of the metrics may take a while.