Fig. 17
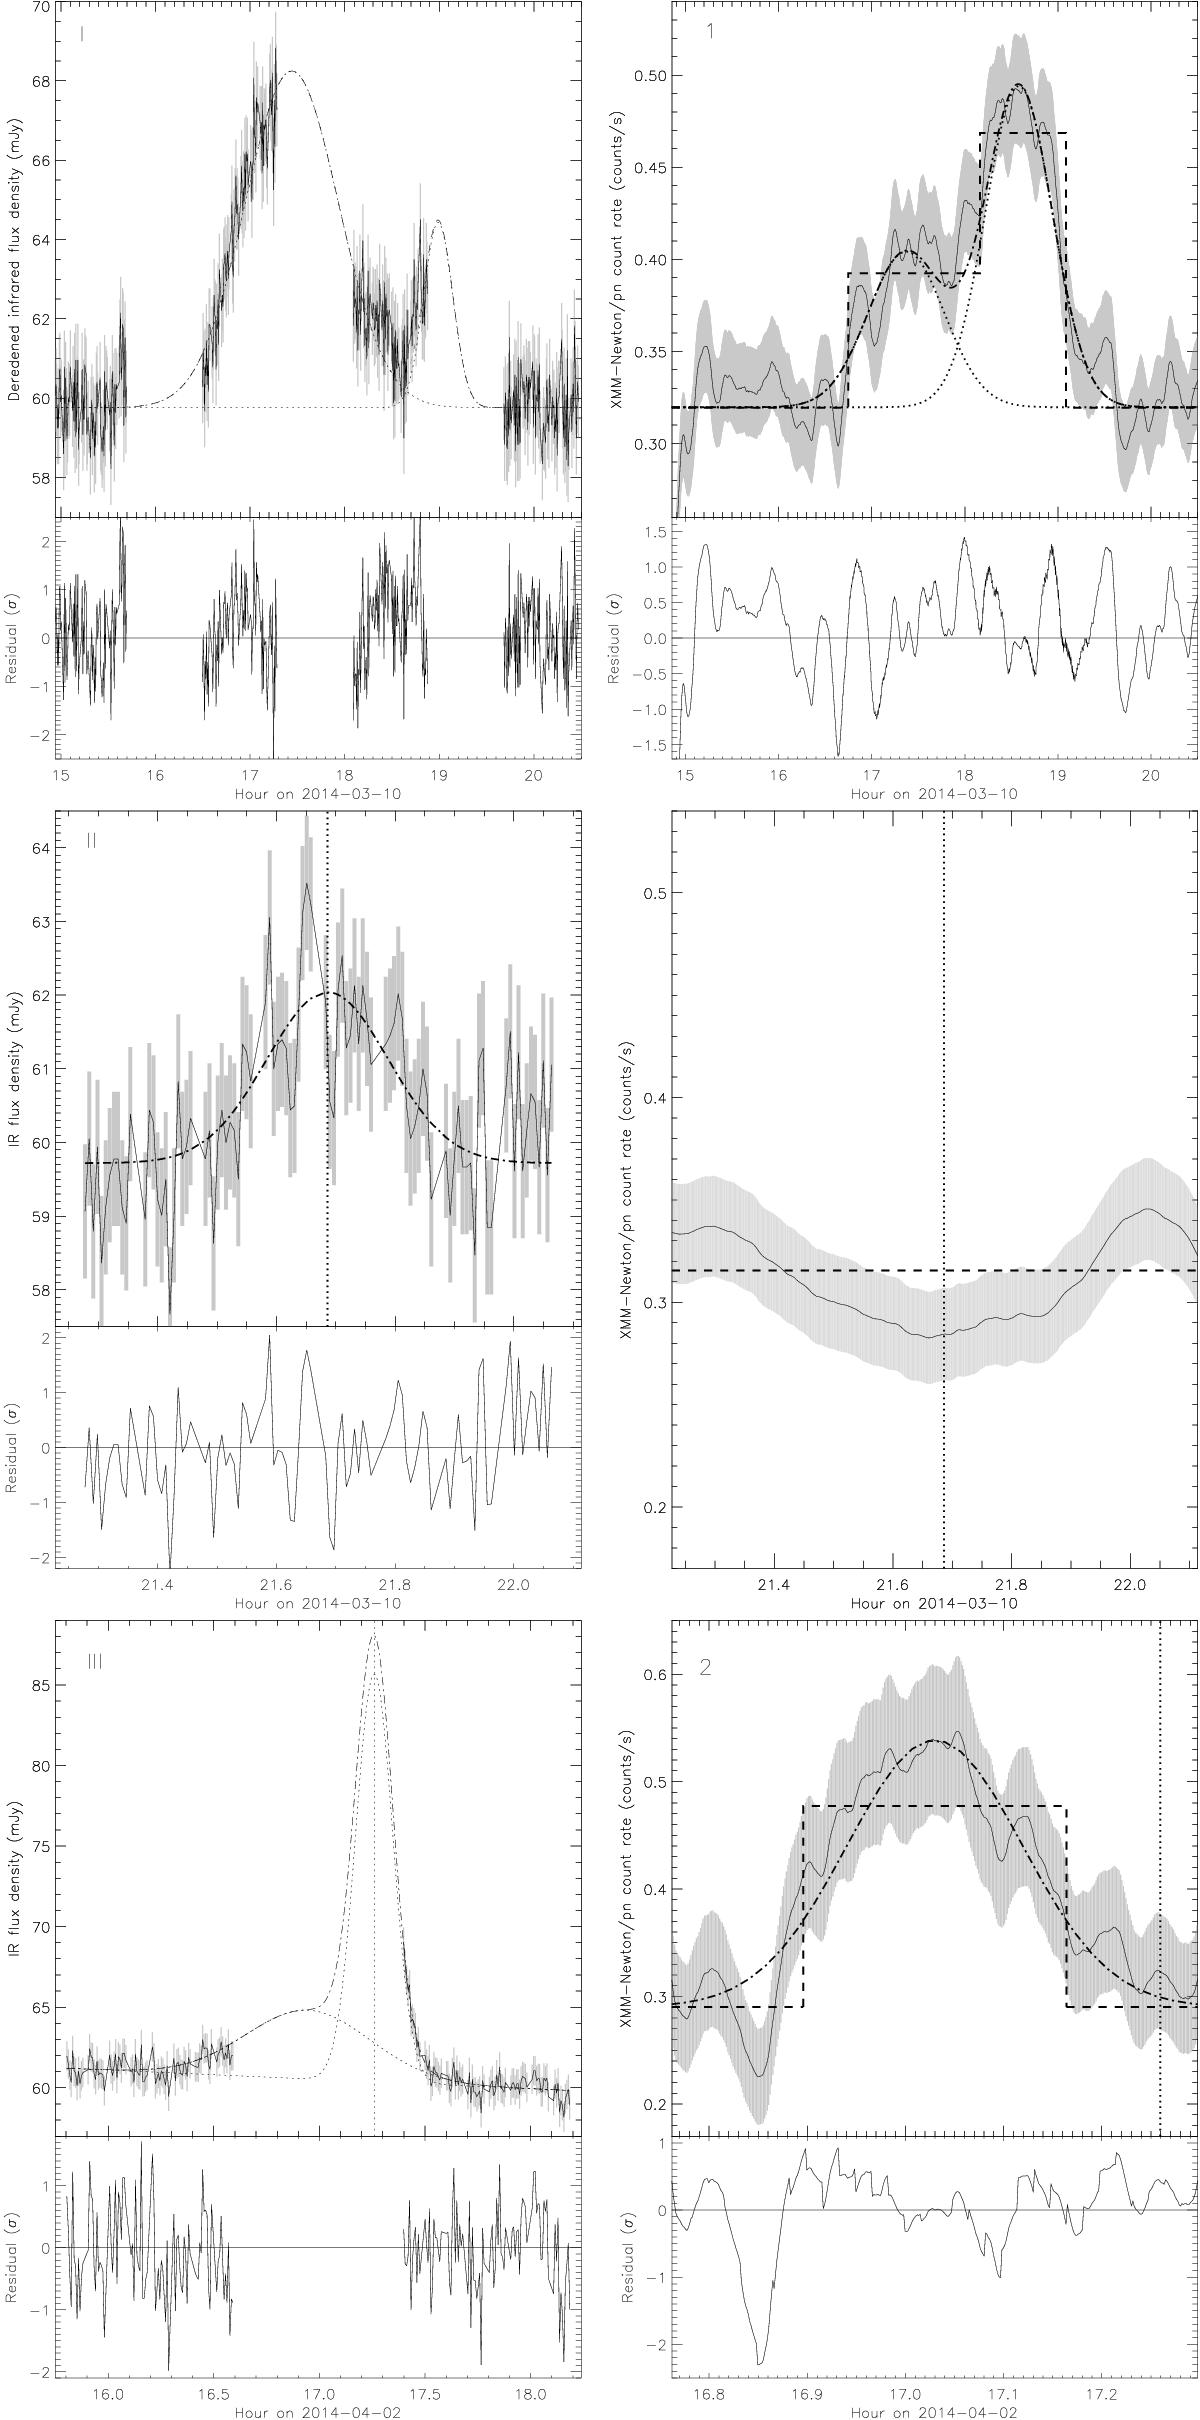
Light curve fitting of the HST NIR flares (left panels) and the X-ray (right panels) counterparts. The solid lines are the observed light curves with the error bars in gray. The dashed lines in right panels are the Bayesian blocks. The X-ray light curves are smoothed with a window width of 500 s and 100 s for 2014 Mar. 10 and Apr. 2, respectively. The dotted lines are the individual Gaussians and the dot-dashed line is the sum of the Gaussians. The vertical dotted lines are the time of the NIR flare peak when there is no detected X-ray counterpart. The residuals are in units of σ.
Current usage metrics show cumulative count of Article Views (full-text article views including HTML views, PDF and ePub downloads, according to the available data) and Abstracts Views on Vision4Press platform.
Data correspond to usage on the plateform after 2015. The current usage metrics is available 48-96 hours after online publication and is updated daily on week days.
Initial download of the metrics may take a while.