Fig. 16
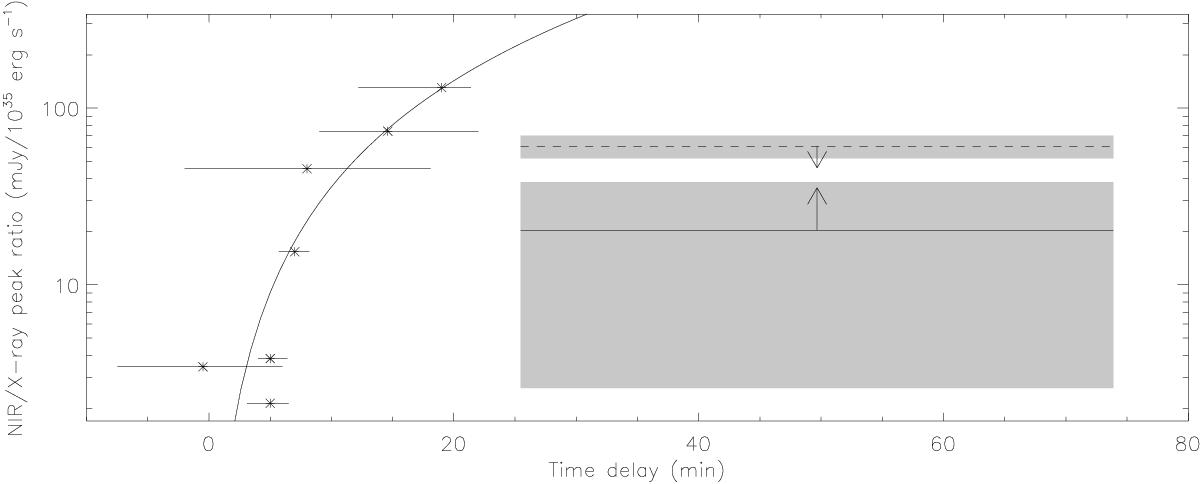
NIR/X-ray peak ratio vs. time delay for the synchrotron-inverse Compton process. The asterisks are the results reported by Yusef-Zadeh et al. (2012), the solid line is a parabolic fit. The horizontal solid line and gray box are the lower limit and error bar on the NIR/X-ray peak ratio of the flare I/1 on 2014 Mar. 10 and the corresponding time-delay range. The dashed line is the ratio between the maximum NIR amplitude reported by Witzel et al. (2012) and the X-ray peak of flare 1, with the gray box being the corresponding error bar (see text for details).
Current usage metrics show cumulative count of Article Views (full-text article views including HTML views, PDF and ePub downloads, according to the available data) and Abstracts Views on Vision4Press platform.
Data correspond to usage on the plateform after 2015. The current usage metrics is available 48-96 hours after online publication and is updated daily on week days.
Initial download of the metrics may take a while.