Fig. 15
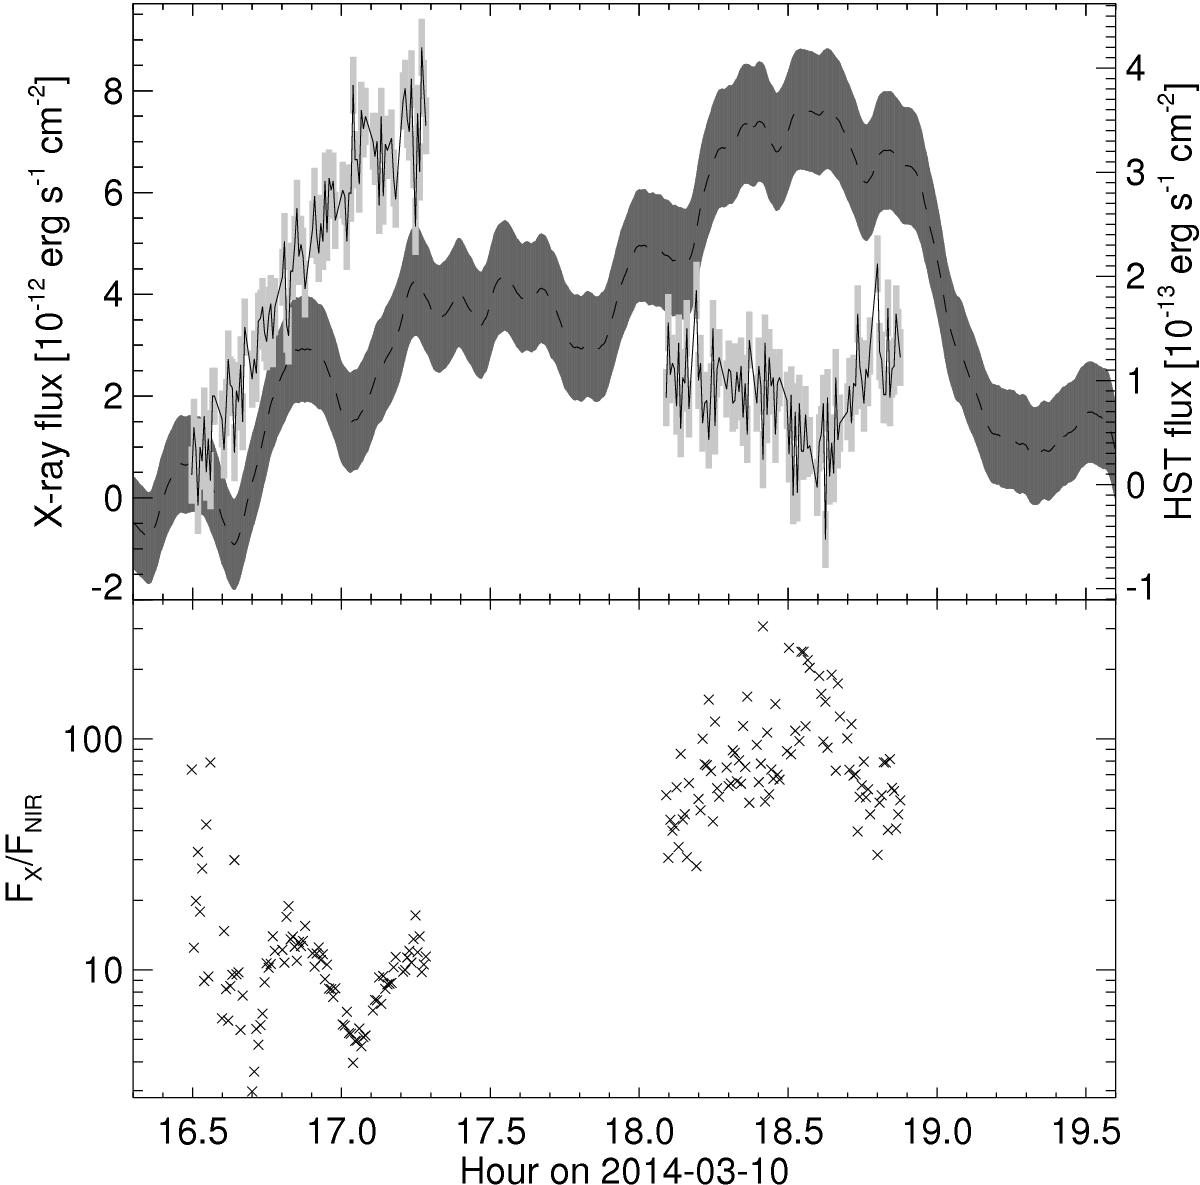
Evolution of the ratio between NIR and X-rays during flare I/1 on 2014 Mar. 10. Top panel: the dashed line surrounded by the dark gray error bars corresponds to the smoothed light curve of the X-ray flare and its flux can be seen on the left y-axis. The solid line and the light gray error bars is the NIR light curve whose flux is read on the right y-axis. Bottom panel: the flux of the X-ray light curve divided by the NIR one.
Current usage metrics show cumulative count of Article Views (full-text article views including HTML views, PDF and ePub downloads, according to the available data) and Abstracts Views on Vision4Press platform.
Data correspond to usage on the plateform after 2015. The current usage metrics is available 48-96 hours after online publication and is updated daily on week days.
Initial download of the metrics may take a while.