Fig. 14
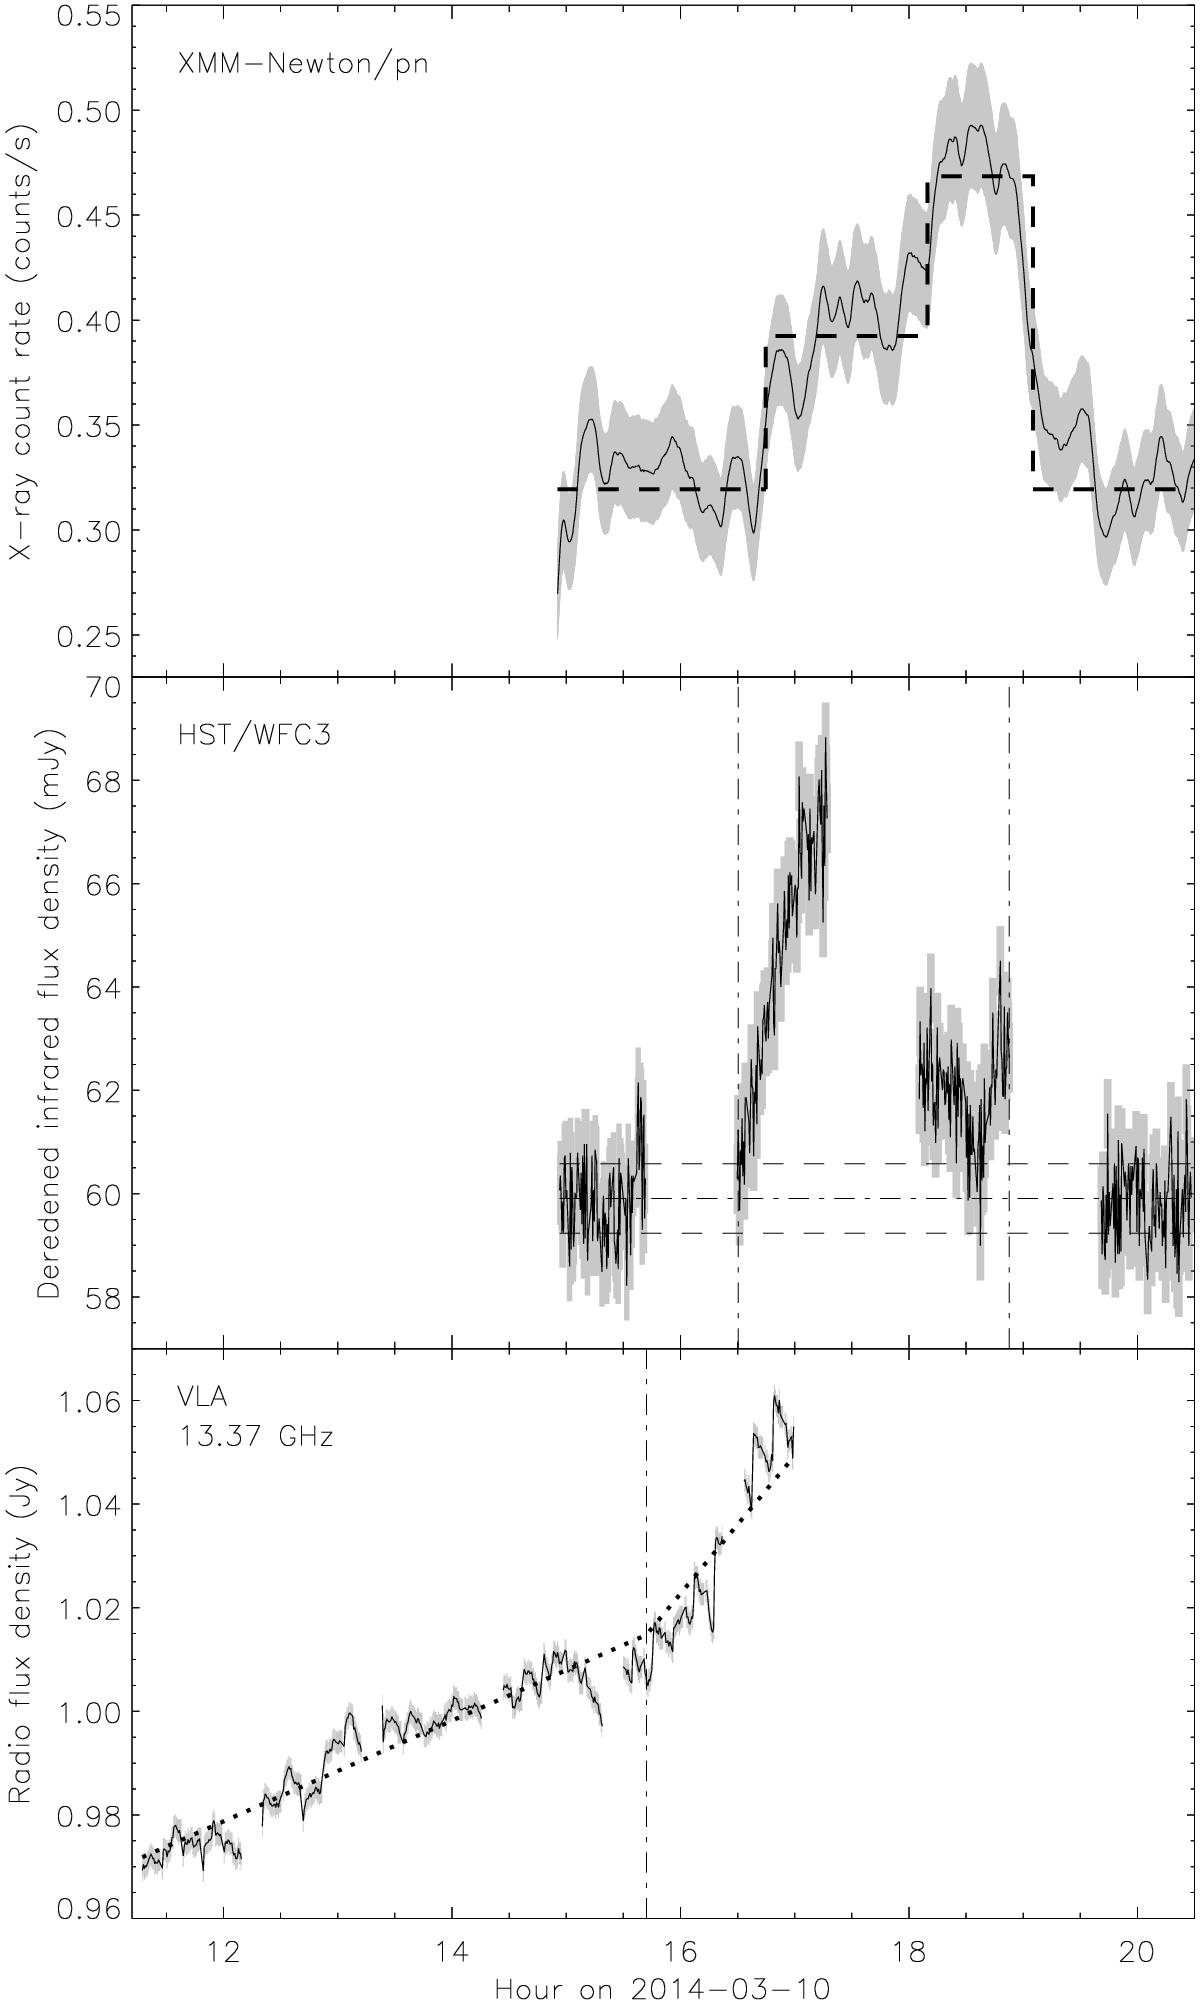
Simultaneous X-ray, NIR and radio observations of flare I/1 from Sgr A* on 2014 Mar. 10. Top panel: the EPIC/pn smoothed light curve computed with a window width of 500 s and its error in gray. The dashed lines are the Bayesian blocks. Middle panel: the deredened HST light curve and its error in gray. The vertical dot-dashed lines are the beginning and the end of the flares. Bottom panel: the VLA light curve at 13.37 GHz. The vertical dot-dashed line is the time of the change of slope. The dashed broken line is the fit.
Current usage metrics show cumulative count of Article Views (full-text article views including HTML views, PDF and ePub downloads, according to the available data) and Abstracts Views on Vision4Press platform.
Data correspond to usage on the plateform after 2015. The current usage metrics is available 48-96 hours after online publication and is updated daily on week days.
Initial download of the metrics may take a while.