Free Access
Fig. 11
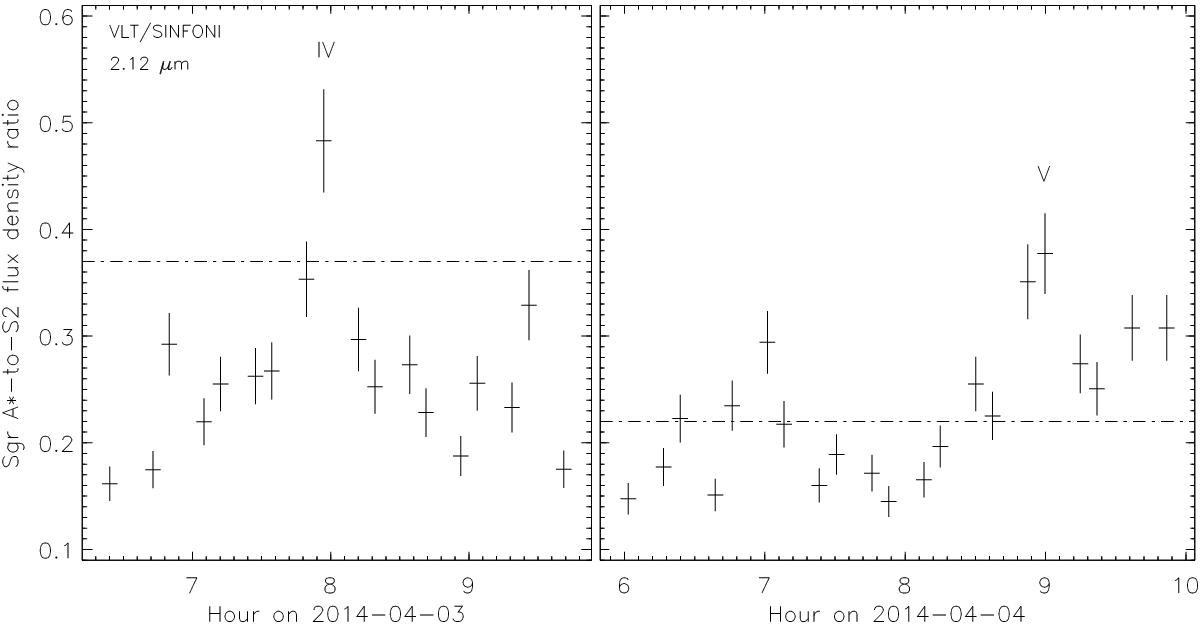
Light curves of Sgr A* obtained with SINFONI at ESO’s VLT during 2014 Apr. 3 and 4. The dash-dotted lines represent the 3σ detection level of Sgr A*. The horizontal segments indicate the exposure length of 400 s. The NIR flares are labeled with Roman numerals.
Current usage metrics show cumulative count of Article Views (full-text article views including HTML views, PDF and ePub downloads, according to the available data) and Abstracts Views on Vision4Press platform.
Data correspond to usage on the plateform after 2015. The current usage metrics is available 48-96 hours after online publication and is updated daily on week days.
Initial download of the metrics may take a while.