Fig. 10
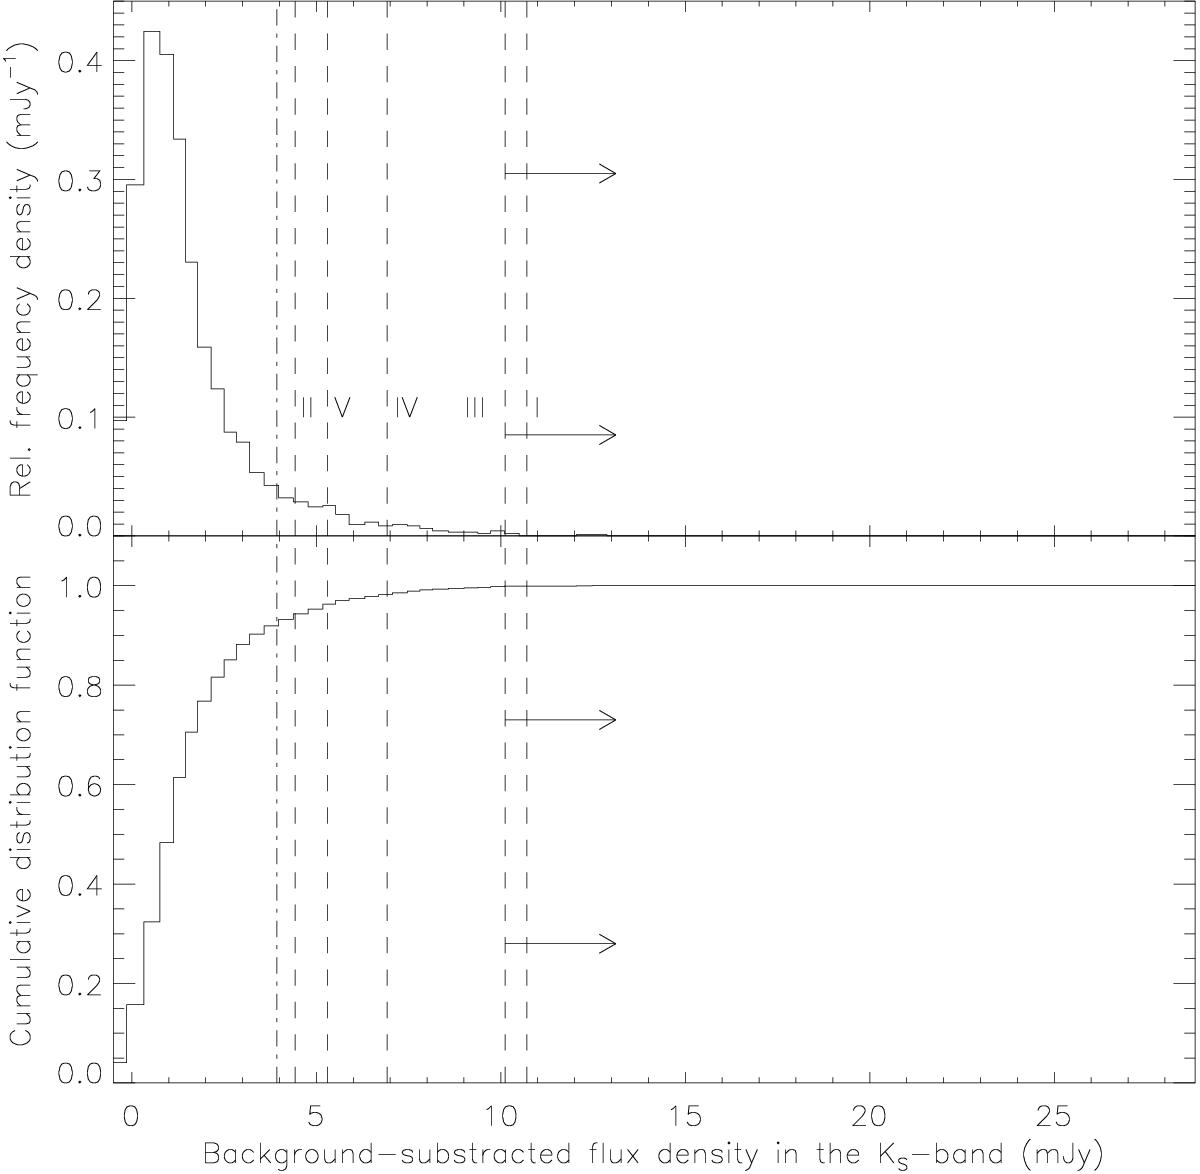
Histogram of the NIR flux densities from Sgr A* observed in the Ks-band with NACO at ESO’s VLT (adapted from Fig. 3 of Witzel et al. 2012). Top panel: the solid line is the normalized distribution of the NIR flux densities corrected from the background emission. The dashed lines are the amplitude of the HST flares I, II and the lower limit of the amplitude of the flare III extrapolated to the Ks-band. We also represented the amplitude above the 3σ limit of the VLT flares IV and V extrapolated to the Ks-band. The dot-dashed line is the detection limit corresponding to 3 times the standard deviation of the quiescent flux density of HST on 2014 Mar. 10. Bottom panel: the cumulative distribution function of the NIR flux densities from Sgr A* corrected from the background emission.
Current usage metrics show cumulative count of Article Views (full-text article views including HTML views, PDF and ePub downloads, according to the available data) and Abstracts Views on Vision4Press platform.
Data correspond to usage on the plateform after 2015. The current usage metrics is available 48-96 hours after online publication and is updated daily on week days.
Initial download of the metrics may take a while.