Fig. 1
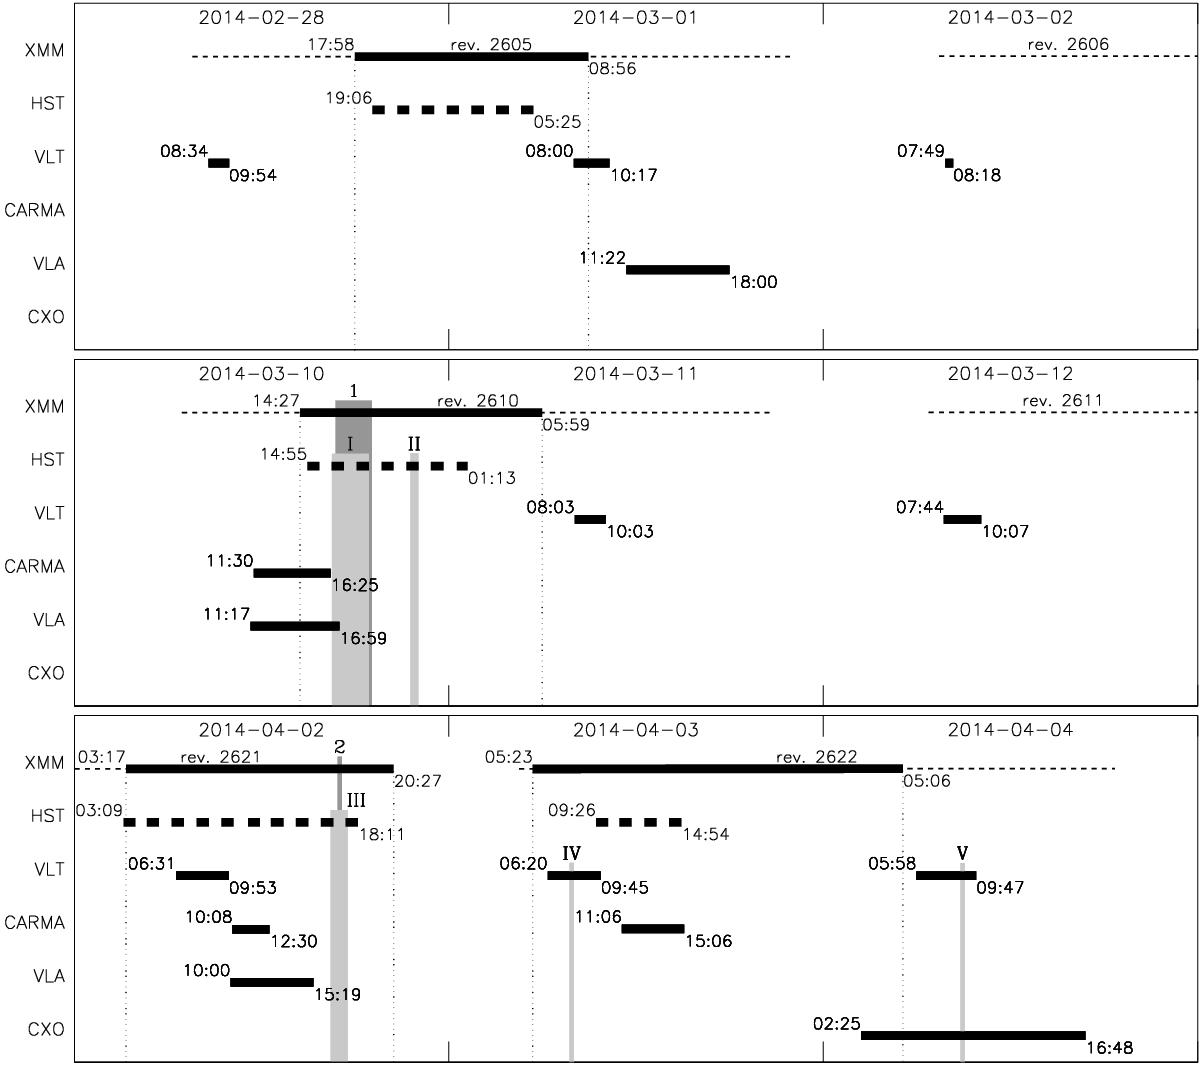
Time diagram of the 2014 Feb.−Apr. campaign. The horizontal dashed lines are the XMM-Newton orbital visibility times of Sgr A* labeled with revolution numbers. The thick solid lines are the time slot of the observations for each instrument with start and stop hours. The vertical dotted lines are the limits of the XMM-Newton observations. The vertical gray blocks are the X-ray (Arabic numerals) and near-IR (Roman numerals) flares reported in this work.
Current usage metrics show cumulative count of Article Views (full-text article views including HTML views, PDF and ePub downloads, according to the available data) and Abstracts Views on Vision4Press platform.
Data correspond to usage on the plateform after 2015. The current usage metrics is available 48-96 hours after online publication and is updated daily on week days.
Initial download of the metrics may take a while.