Free Access
Fig. 9
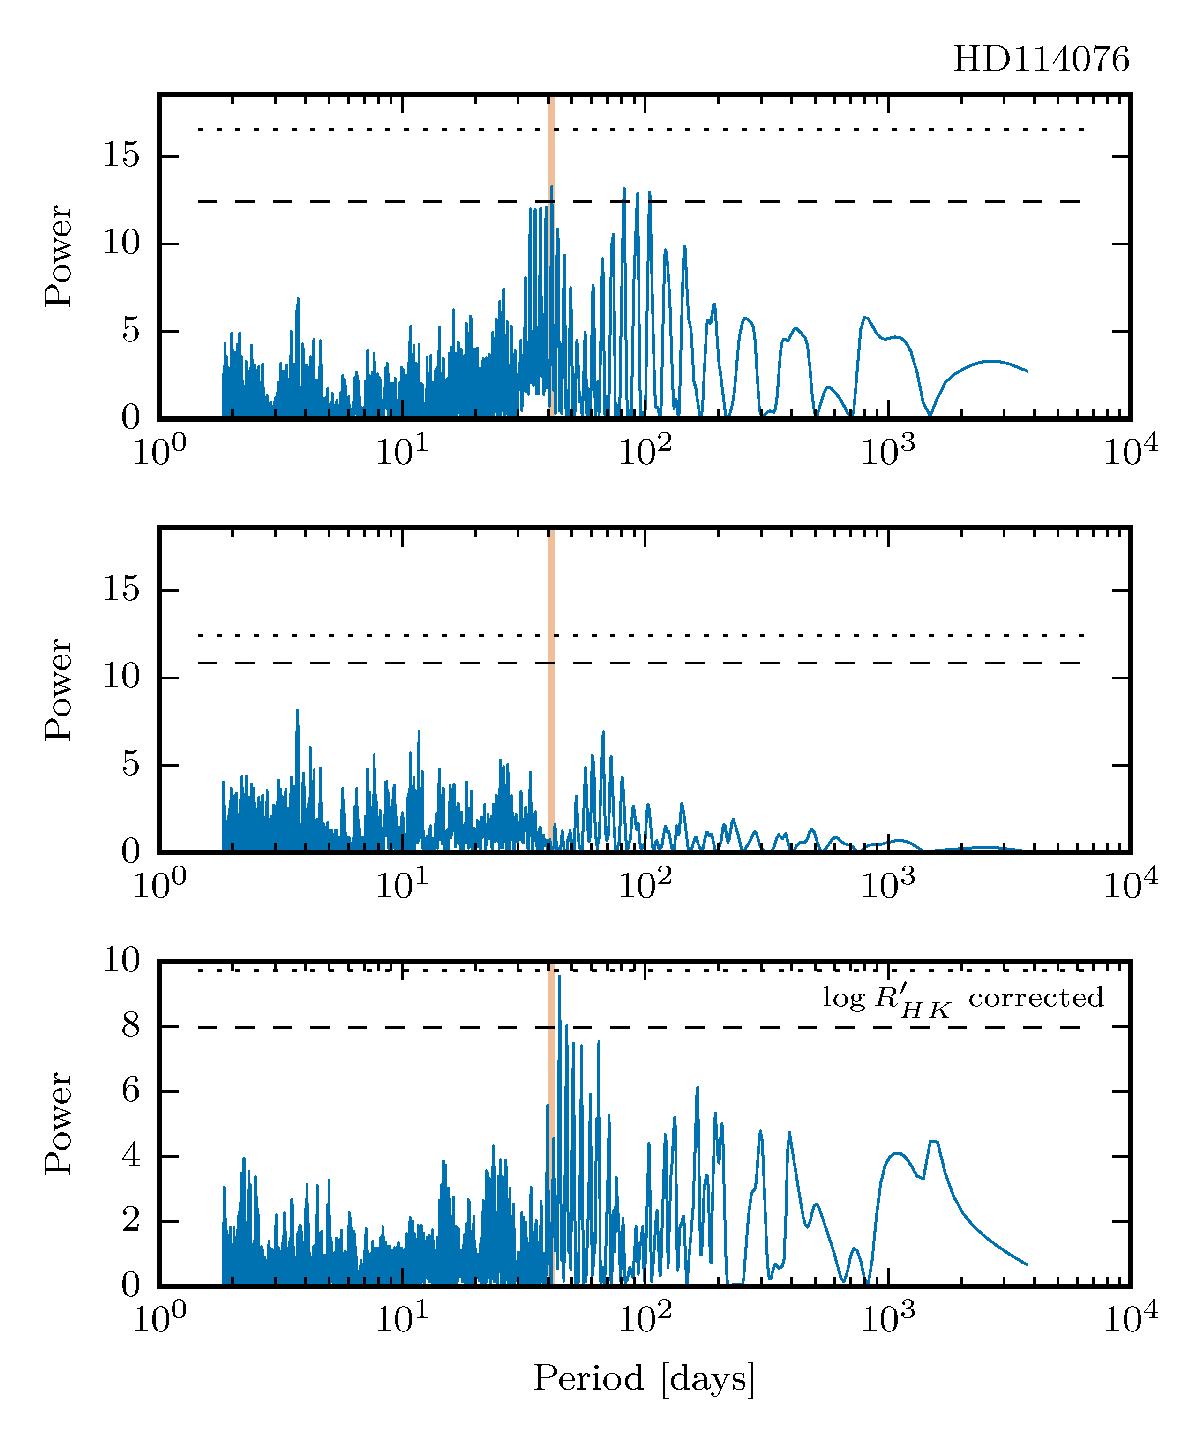
Periodogram for HD 114076 before (top) and after (middle) fitting and removing a sine function to correct for activity-induced variations. The vertical dashed line indicates the best fit period of 41.27 d. The bottom plot shows the periodogram of the ![]() index after removing a quadratic polynomial from the observed values.
index after removing a quadratic polynomial from the observed values.
Current usage metrics show cumulative count of Article Views (full-text article views including HTML views, PDF and ePub downloads, according to the available data) and Abstracts Views on Vision4Press platform.
Data correspond to usage on the plateform after 2015. The current usage metrics is available 48-96 hours after online publication and is updated daily on week days.
Initial download of the metrics may take a while.