Fig. 7
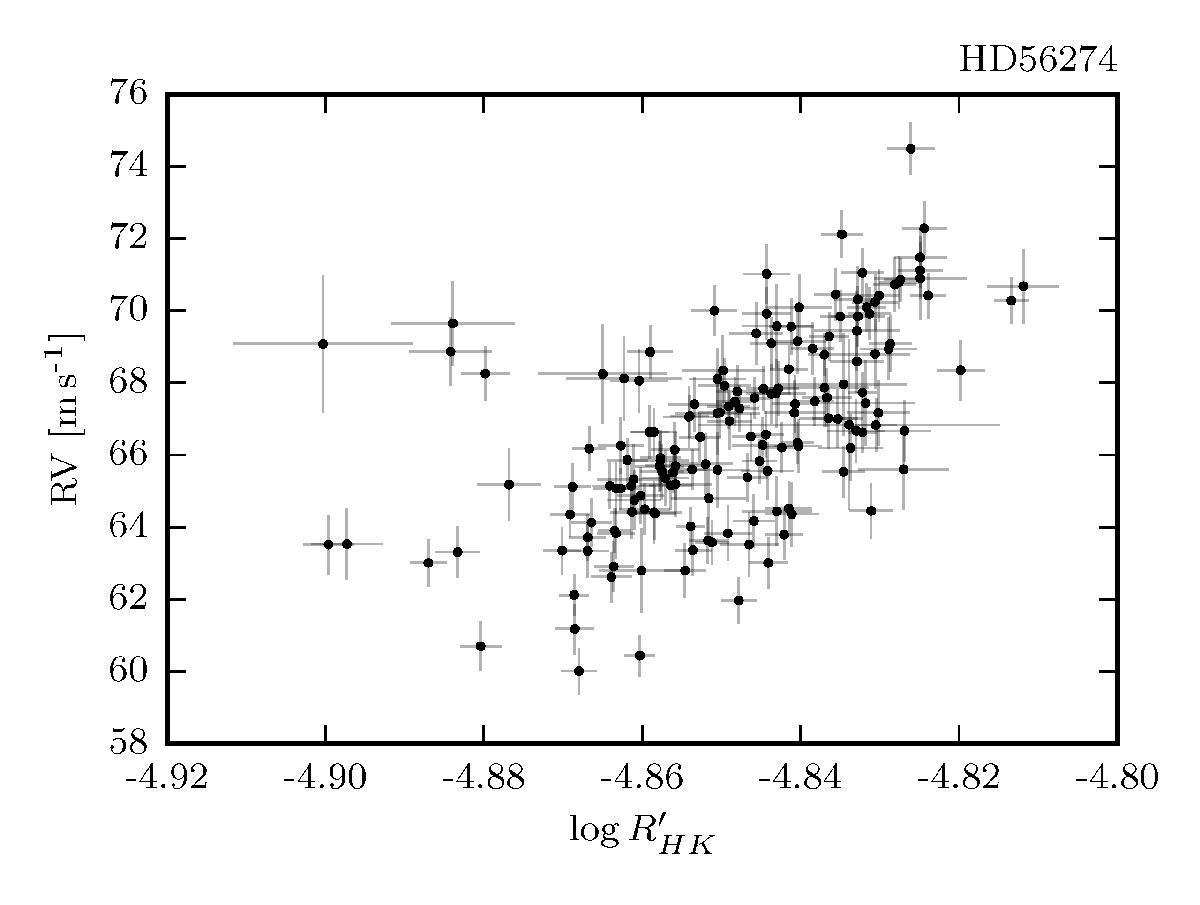
Radial-velocity versus the ![]() activity indicator for HD 56274. We estimate the posterior distribution for Spearman’s rank correlation coefficient using an MCMC. The posterior has a mean value of 0.62 and a 95% credible interval [ 0.52,0.71 ] for these data, suggesting a tight correlation, very likely caused by a long-term activity cycle.
activity indicator for HD 56274. We estimate the posterior distribution for Spearman’s rank correlation coefficient using an MCMC. The posterior has a mean value of 0.62 and a 95% credible interval [ 0.52,0.71 ] for these data, suggesting a tight correlation, very likely caused by a long-term activity cycle.
Current usage metrics show cumulative count of Article Views (full-text article views including HTML views, PDF and ePub downloads, according to the available data) and Abstracts Views on Vision4Press platform.
Data correspond to usage on the plateform after 2015. The current usage metrics is available 48-96 hours after online publication and is updated daily on week days.
Initial download of the metrics may take a while.