Fig. 15
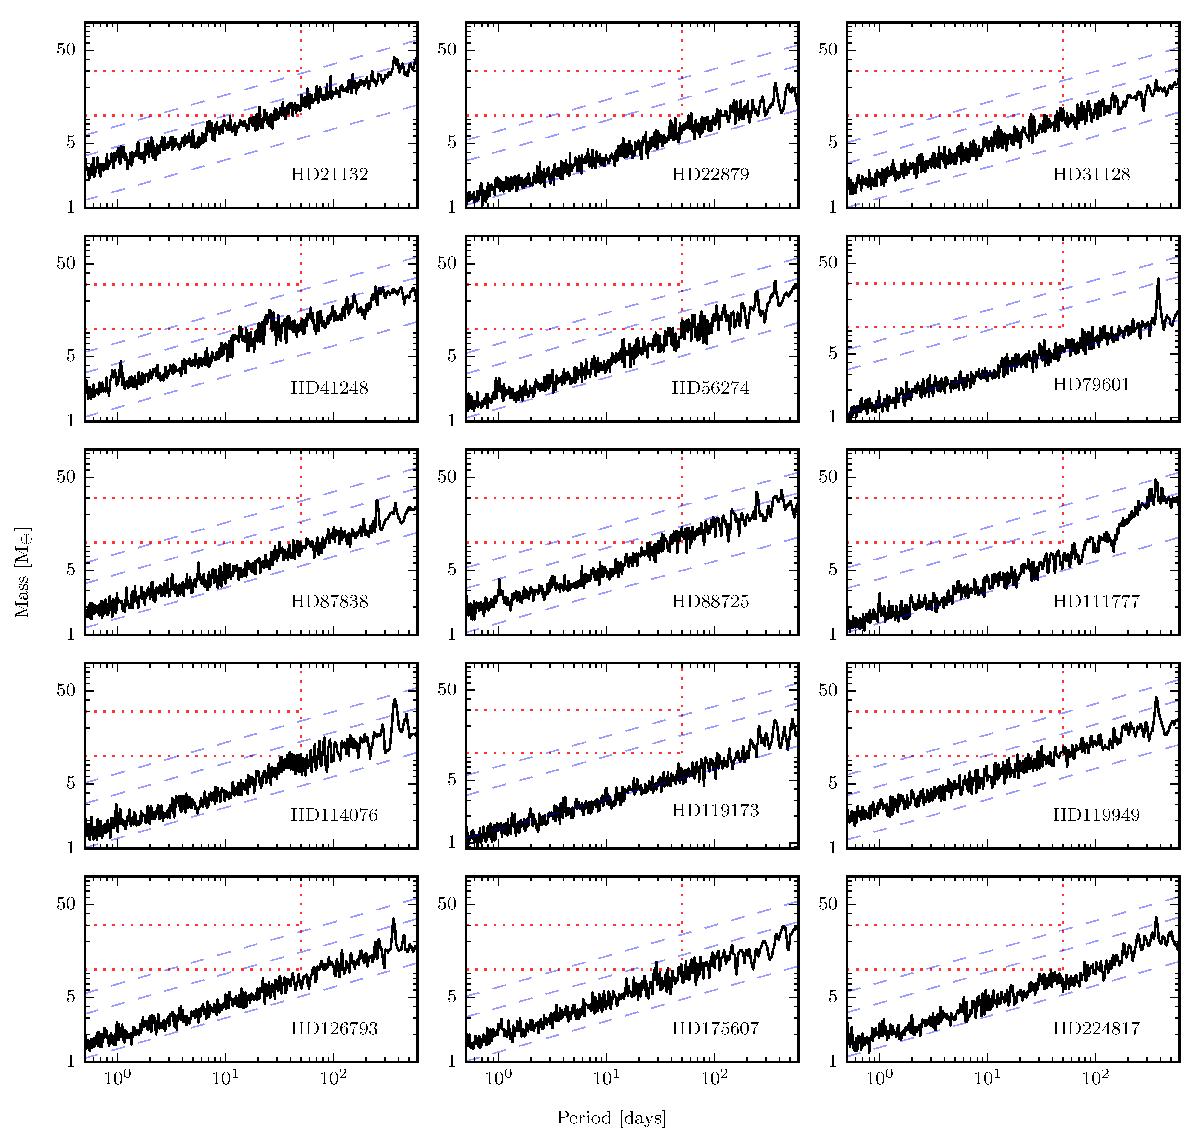
Detection limits for the 15 stars studied in this work. The plots show planetary mass against orbital period. The thick black line shows the 99% detection limits, estimated by injecting trial circular orbits. The dashed blue lines represent circular planetary signals with RV semi-amplitudes of 1, 3, and 5 ms-1 (from bottom to top in each panel). The regions delimited by the red dotted lines correspond to periods lower than 50 d, and masses in the ranges M = 10−30 M⊕ and M = 30−100 M⊕.
Current usage metrics show cumulative count of Article Views (full-text article views including HTML views, PDF and ePub downloads, according to the available data) and Abstracts Views on Vision4Press platform.
Data correspond to usage on the plateform after 2015. The current usage metrics is available 48-96 hours after online publication and is updated daily on week days.
Initial download of the metrics may take a while.