Free Access
Fig. 9
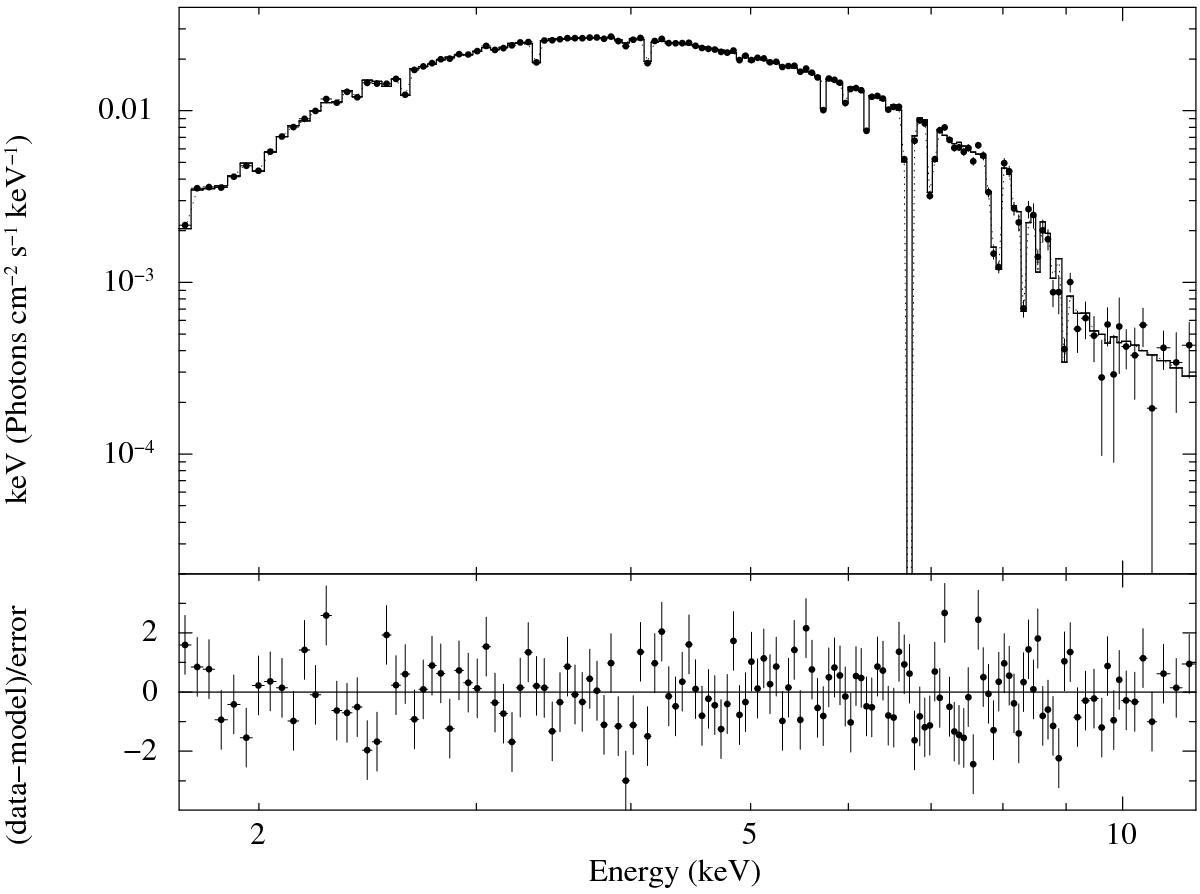
Best fit to the average EPIC-pn spectrum of the steady emission from IGR J17451–3022 (excluding the time intervals corresponding to the eclipses and the dips) with the physical model described in Sect. 4.2.1. We show here the unfolded spectrum. The residuals from the fit are shown in the bottom panel.
Current usage metrics show cumulative count of Article Views (full-text article views including HTML views, PDF and ePub downloads, according to the available data) and Abstracts Views on Vision4Press platform.
Data correspond to usage on the plateform after 2015. The current usage metrics is available 48-96 hours after online publication and is updated daily on week days.
Initial download of the metrics may take a while.