Free Access
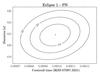
Fig. 6
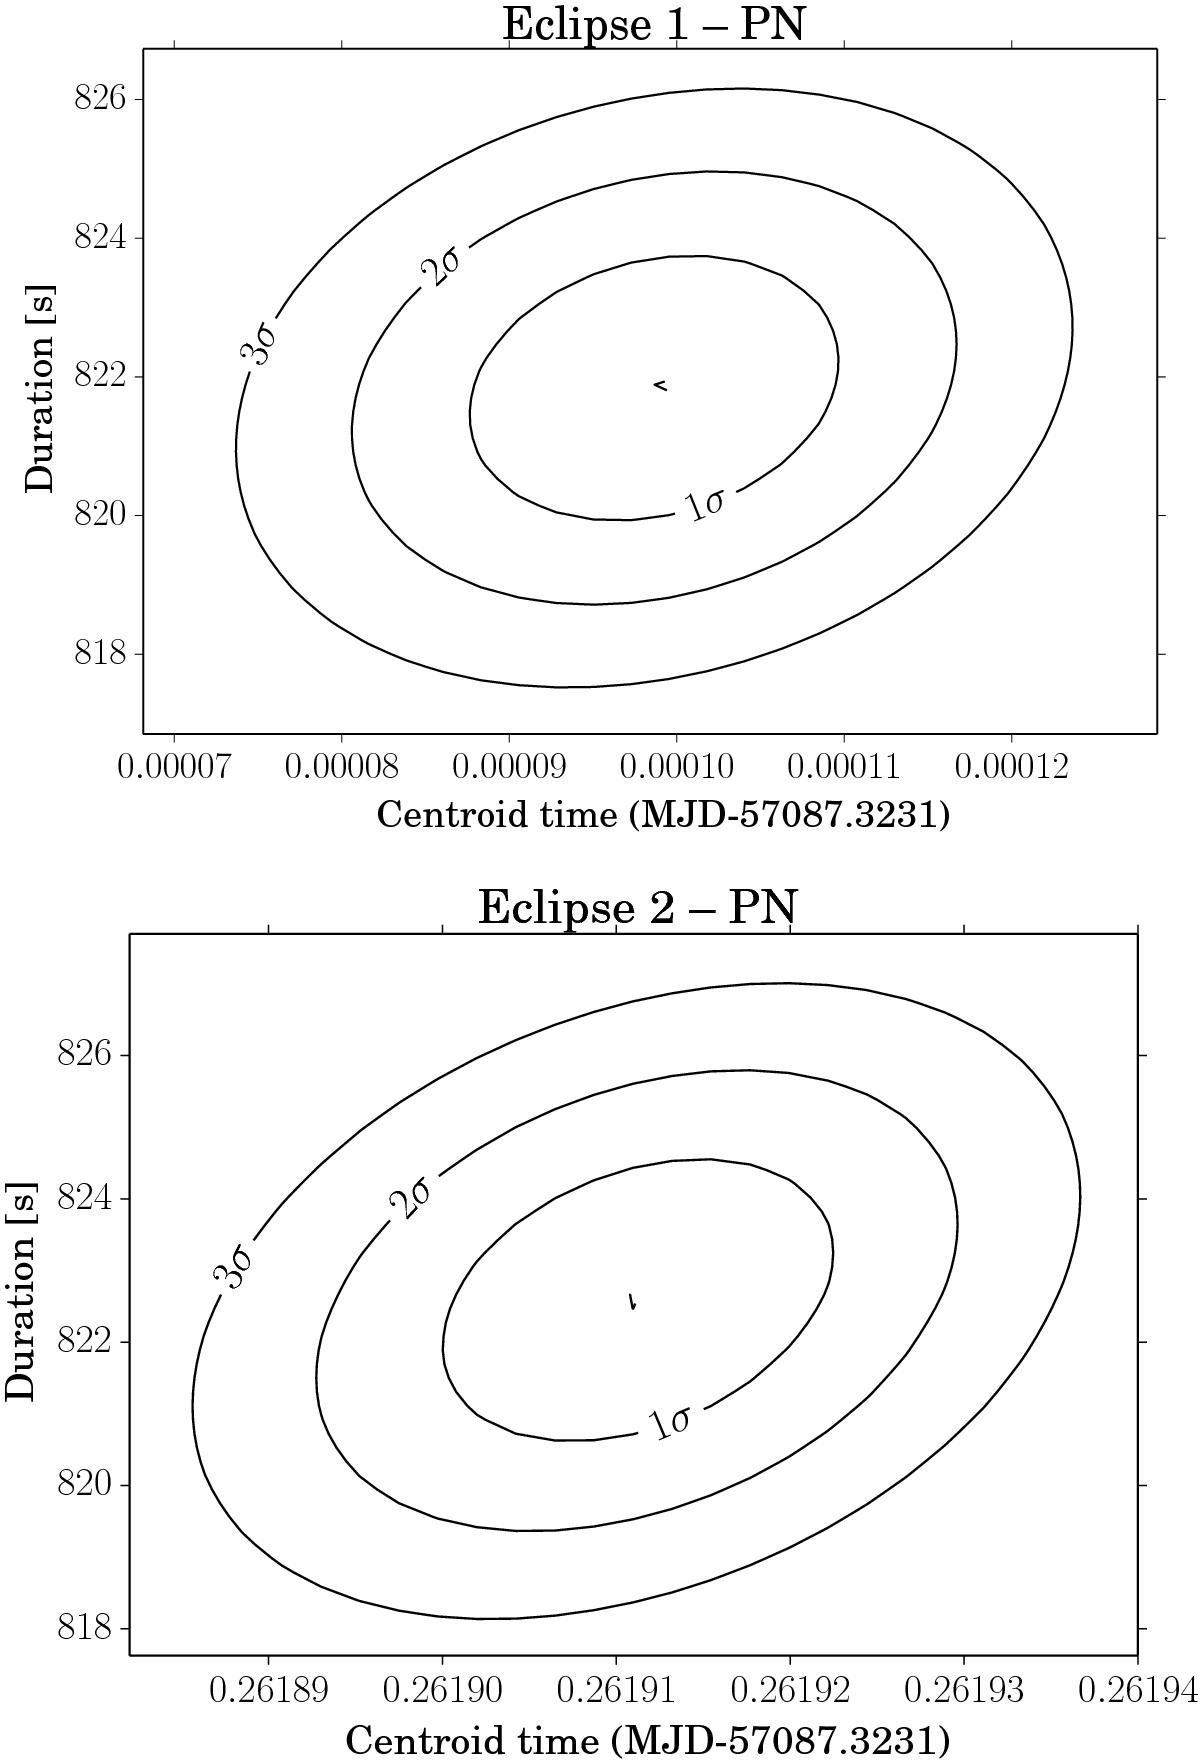
Contour plots of the two eclipses durations and mid-epochs obtained by fitting the rectangular eclipse model to the data. The 1σ, 2σ, and 3σ contours around the best determined values are indicated.
This figure is made of several images, please see below:
Current usage metrics show cumulative count of Article Views (full-text article views including HTML views, PDF and ePub downloads, according to the available data) and Abstracts Views on Vision4Press platform.
Data correspond to usage on the plateform after 2015. The current usage metrics is available 48-96 hours after online publication and is updated daily on week days.
Initial download of the metrics may take a while.