Fig. 9
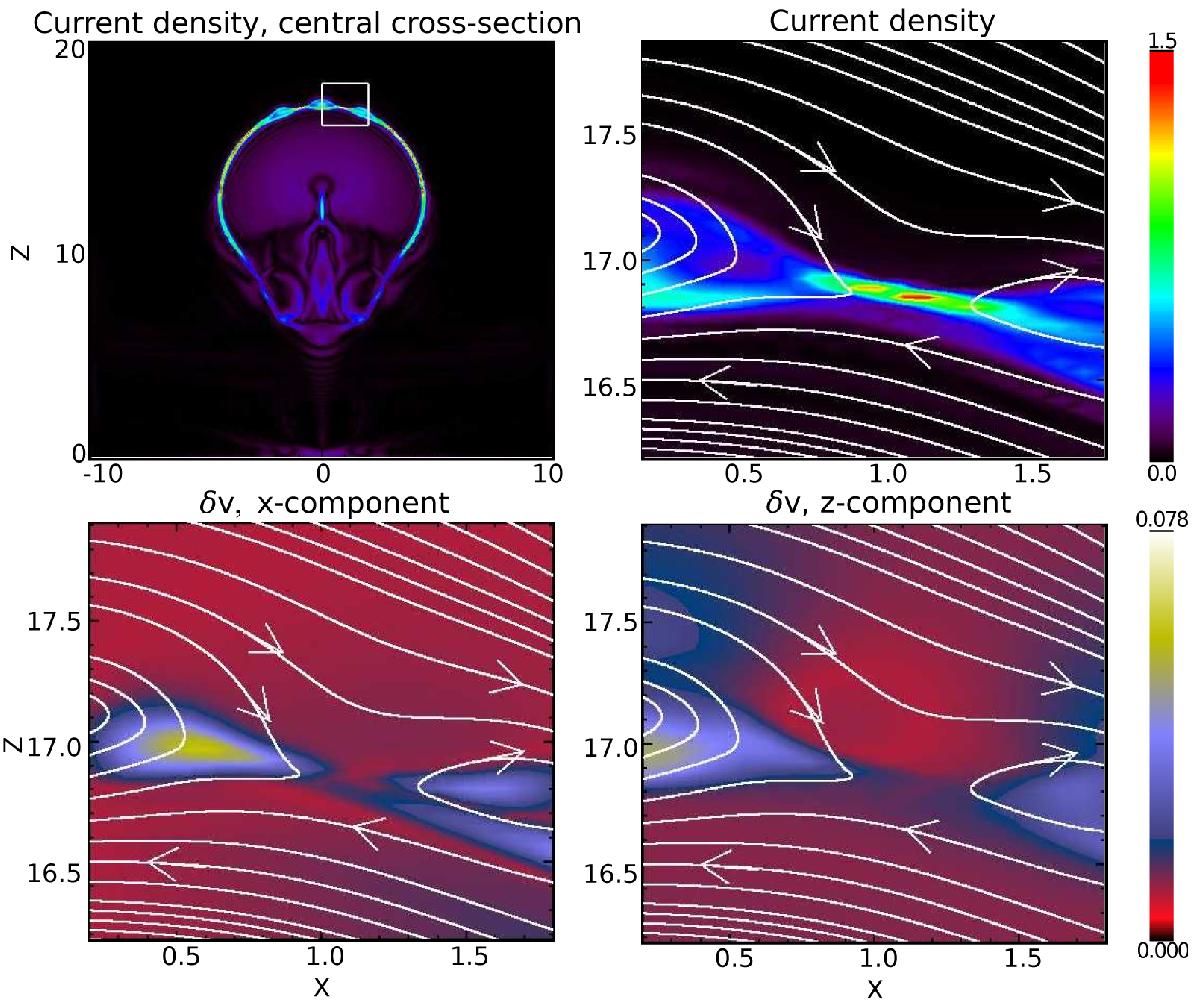
Distributions of current density | j | and velocity deviations δv(x,z) around one of the energy release regions. Top left plot shows the global current density distribution at x = 0 plane and the location of the sampled region. Current density distribution and magnetic field lines in the selected region are shown in the top right panel. Distributions of the ρ2T-weighted velocity deviations (see text for details) are shown in the bottom left (x-component) and bottom right (z-component) panels. (Here the units of the current density colour scale are 3.6 × 10⁻³ A m-2 and the units of the ρ2T-weighted velocity colour scale are 2.8 × 10³ km s-1). Distances are in 106 m.
Current usage metrics show cumulative count of Article Views (full-text article views including HTML views, PDF and ePub downloads, according to the available data) and Abstracts Views on Vision4Press platform.
Data correspond to usage on the plateform after 2015. The current usage metrics is available 48-96 hours after online publication and is updated daily on week days.
Initial download of the metrics may take a while.