Fig. 7
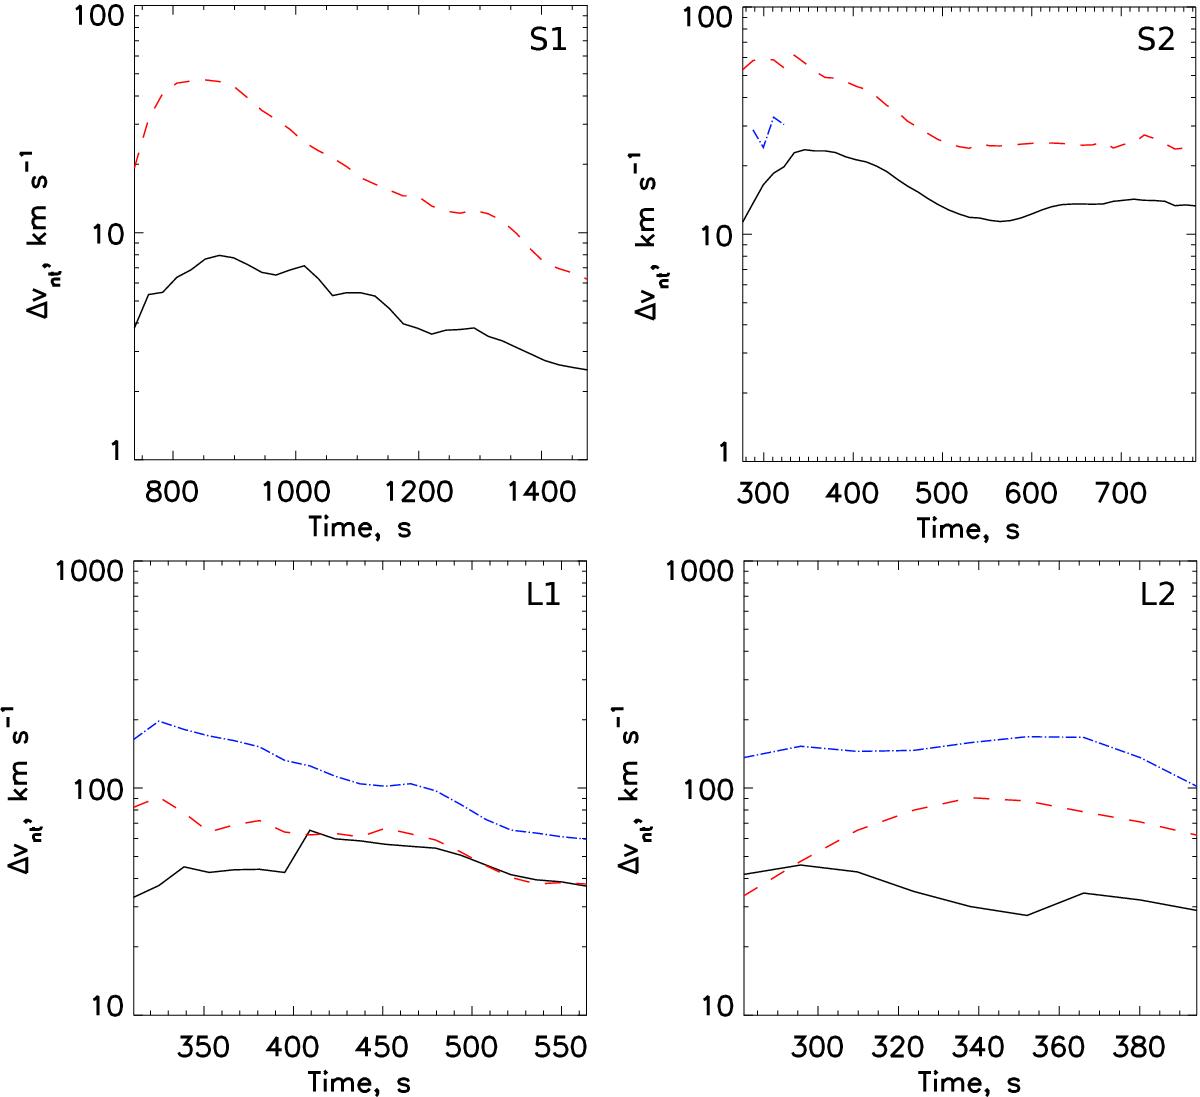
Variation of velocity dispersions calculated over the whole domain in three temperature bands in the four models after kink instabilities. Model names are shown in panels. Black solid line is for the 0.25 MK <T< MK band, red dashed line is for 1 MK <T<4 MK, and blue dot-dashed line is for T> 4 MK. (There is practically no plasma with temperature >4 MK in models S1 and S2.) Lower limits of each time interval correspond approximately to the onset of kink instability and fast energy release.
Current usage metrics show cumulative count of Article Views (full-text article views including HTML views, PDF and ePub downloads, according to the available data) and Abstracts Views on Vision4Press platform.
Data correspond to usage on the plateform after 2015. The current usage metrics is available 48-96 hours after online publication and is updated daily on week days.
Initial download of the metrics may take a while.