Fig. 3
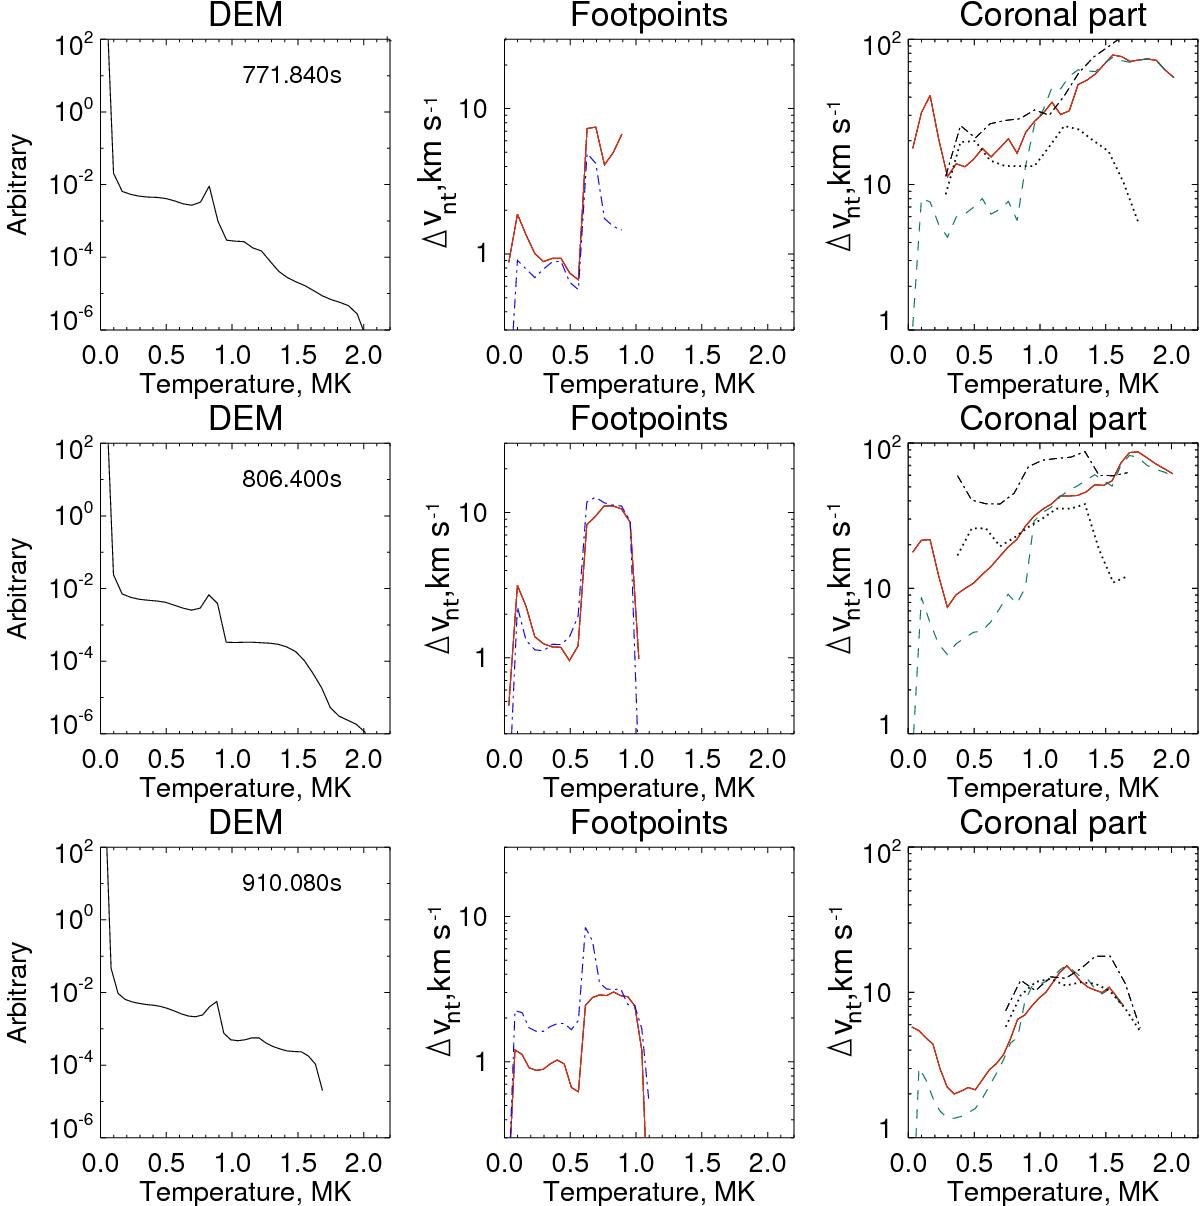
Model S1. Left column: differential emission measure versus temperature for the whole domain. Middle column: average n2-weighted velocity dispersions Δvnt(T) (calculated as ![]() ) for the footpoint location for x-component (red solid lines) and z-component (blue dot-dashed lines) of the velocity. Right column: green dashed line is Δvnt(T) for the whole domain; red solid lines is the Δvnt(T) for the coronal part of the loop; black lines are Δvnt(T) for the loop-top region (dot-dashed line is for y-component and dotted line is for z-component of the velocity). Corresponding times are shown in the left panels. Locations of the sampling regions are shown in Fig. 2.
) for the footpoint location for x-component (red solid lines) and z-component (blue dot-dashed lines) of the velocity. Right column: green dashed line is Δvnt(T) for the whole domain; red solid lines is the Δvnt(T) for the coronal part of the loop; black lines are Δvnt(T) for the loop-top region (dot-dashed line is for y-component and dotted line is for z-component of the velocity). Corresponding times are shown in the left panels. Locations of the sampling regions are shown in Fig. 2.
Current usage metrics show cumulative count of Article Views (full-text article views including HTML views, PDF and ePub downloads, according to the available data) and Abstracts Views on Vision4Press platform.
Data correspond to usage on the plateform after 2015. The current usage metrics is available 48-96 hours after online publication and is updated daily on week days.
Initial download of the metrics may take a while.