Fig. 1
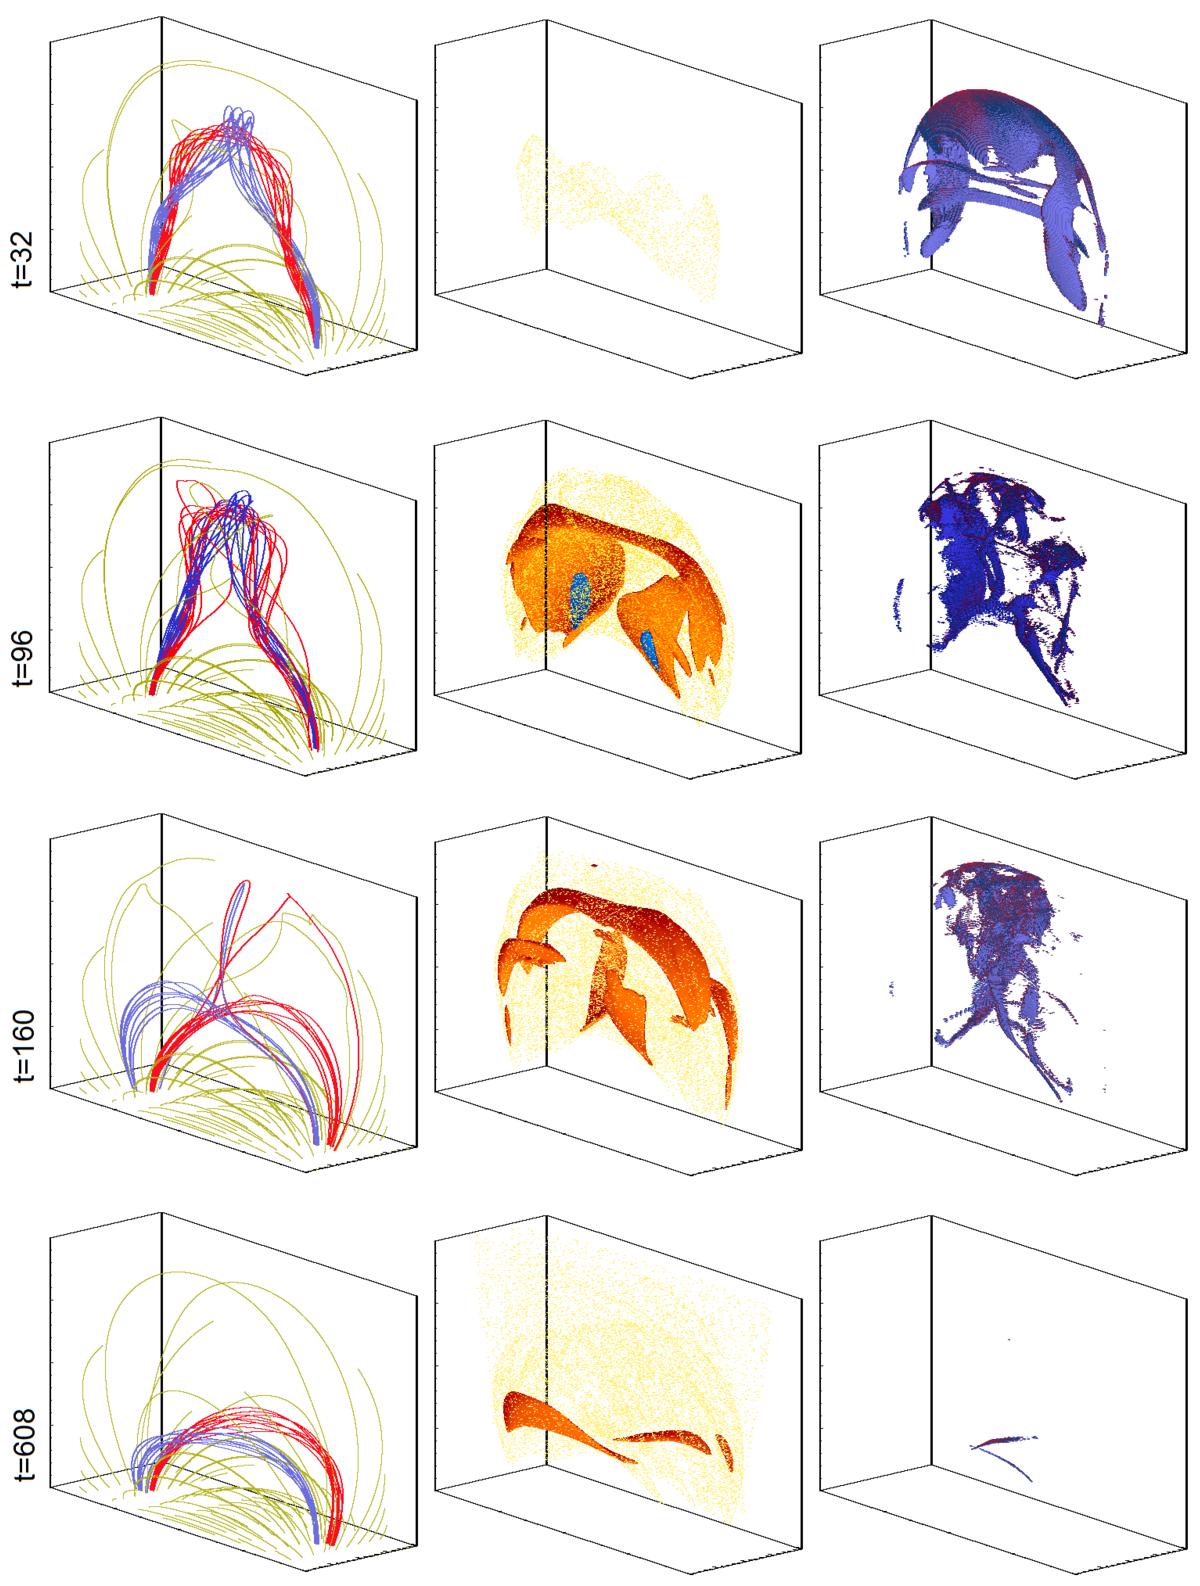
Evolution of Model L1. Left column: magnetic field lines; red and blue field lines are tied to opposite footpoints of the twisted loop; yellow lines denote ambient field. Middle column: temperature distribution; yellow patchy surface corresponds to 2 MK; orange and blue surfaces correspond to 3 and 4 MK, respectively. Right column: surfaces of j = jcrit, i.e. showing the locations with fast magnetic energy release. Times (after onset of the instability) are shown for each row on the left in units of characteristic Alfvén times tA, which are 0.44 s for this model.
Current usage metrics show cumulative count of Article Views (full-text article views including HTML views, PDF and ePub downloads, according to the available data) and Abstracts Views on Vision4Press platform.
Data correspond to usage on the plateform after 2015. The current usage metrics is available 48-96 hours after online publication and is updated daily on week days.
Initial download of the metrics may take a while.