Fig. 8
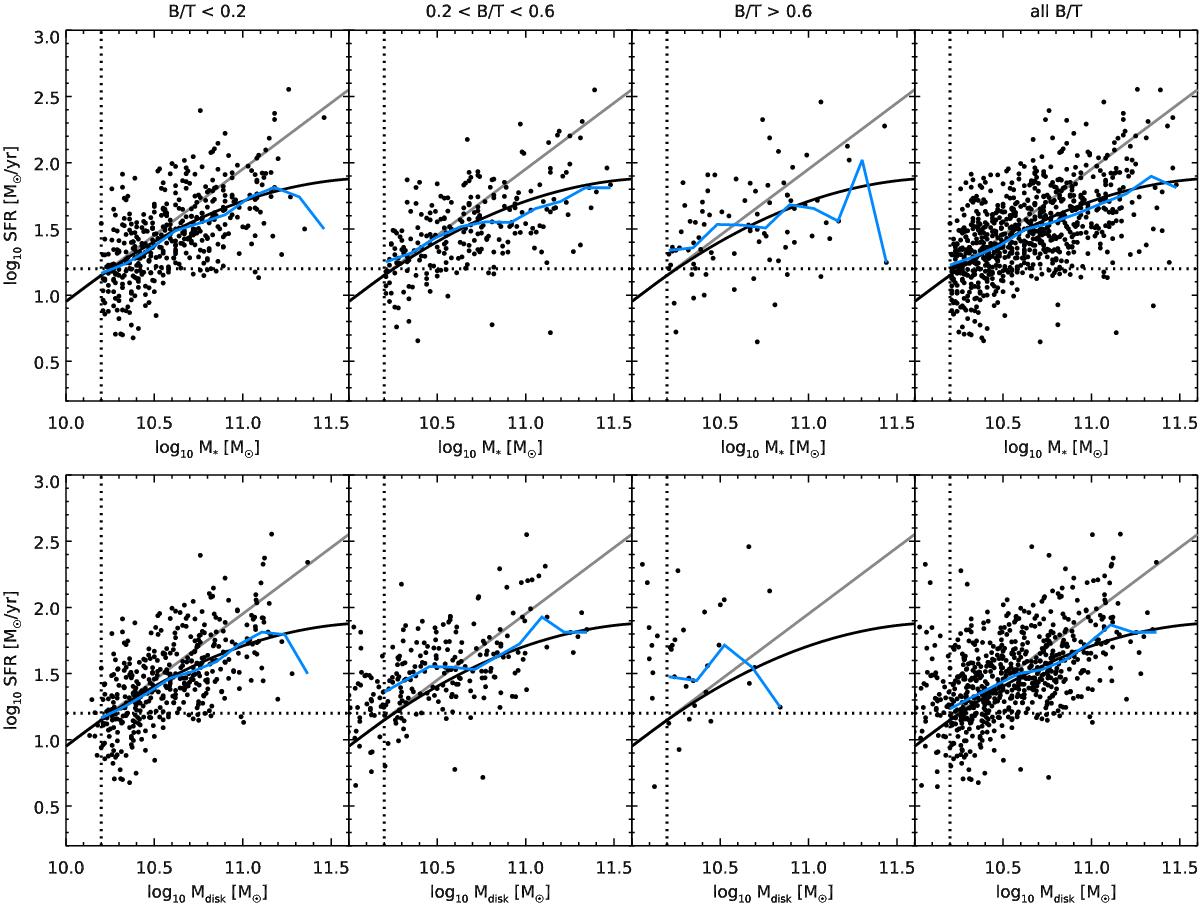
Upper panel: location of galaxies from the IR-sample with varying B/T on the SFR−M∗ plane, using the stellar mass and star formation rate (IR+UV) of the whole galaxy. On all plots, the vertical dotted line shows our adopted stellar mass cut, the horizontal dotted line is the 90% completeness in SFR, and the solid black line shows the locus of the z = 1 main sequence as observed through stacking in S15, while the solid gray line shows the extrapolation of the low-mass trend assuming a slope of unity, as observed at lower stellar masses (see Fig. 1). In each column, galaxies of different B/T are plotted. In the rightmost panel, we show all galaxies regardless of their B/T. The solid blue lines show the running median of the sample. Lower panel: same as upper panel, but on the SFR−Mdisk plane.
Current usage metrics show cumulative count of Article Views (full-text article views including HTML views, PDF and ePub downloads, according to the available data) and Abstracts Views on Vision4Press platform.
Data correspond to usage on the plateform after 2015. The current usage metrics is available 48-96 hours after online publication and is updated daily on week days.
Initial download of the metrics may take a while.