Fig. 7
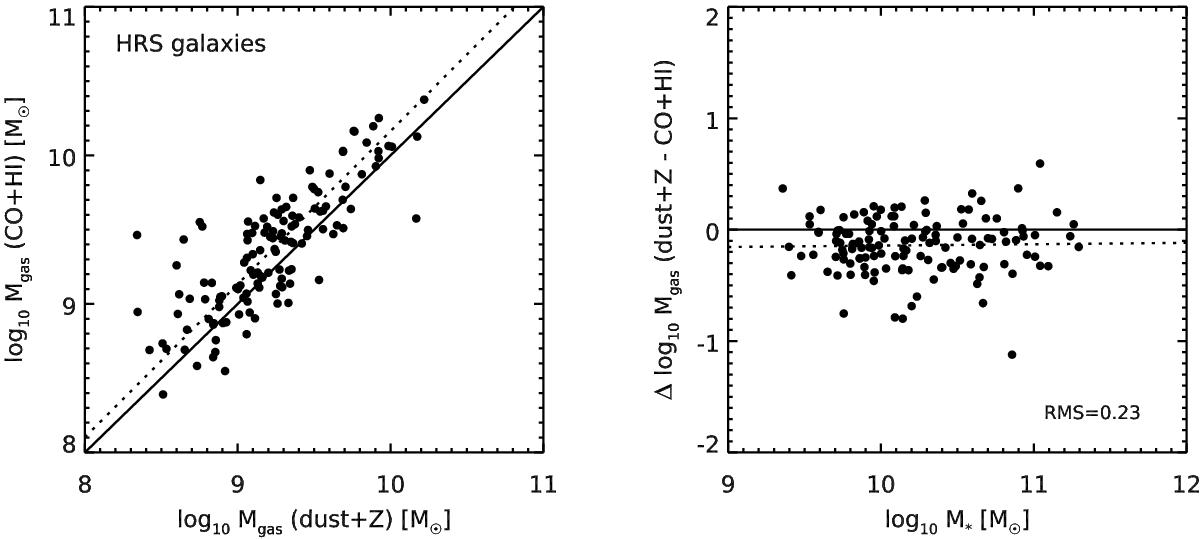
Left: comparison of two independent estimates of the total (H i + H2) gas masses for the HRS galaxies, either using the dust mass and the metallicity as described in Sect. 4.3 (x axis) or using a more direct measurement from H i+CO spectroscopy (y axis). The black solid line shows the one-to-one relation, while the dotted line gives the best-fit linear trend (slope: 1.03 ± 0.03). Right: difference between these two independent gas mass estimates as a function of stellar mass. The black solid line is the line of perfect agreement, while the dotted line is the best-fit linear trend (slope: 0.01 ± 0.04).
Current usage metrics show cumulative count of Article Views (full-text article views including HTML views, PDF and ePub downloads, according to the available data) and Abstracts Views on Vision4Press platform.
Data correspond to usage on the plateform after 2015. The current usage metrics is available 48-96 hours after online publication and is updated daily on week days.
Initial download of the metrics may take a while.