Fig. 5
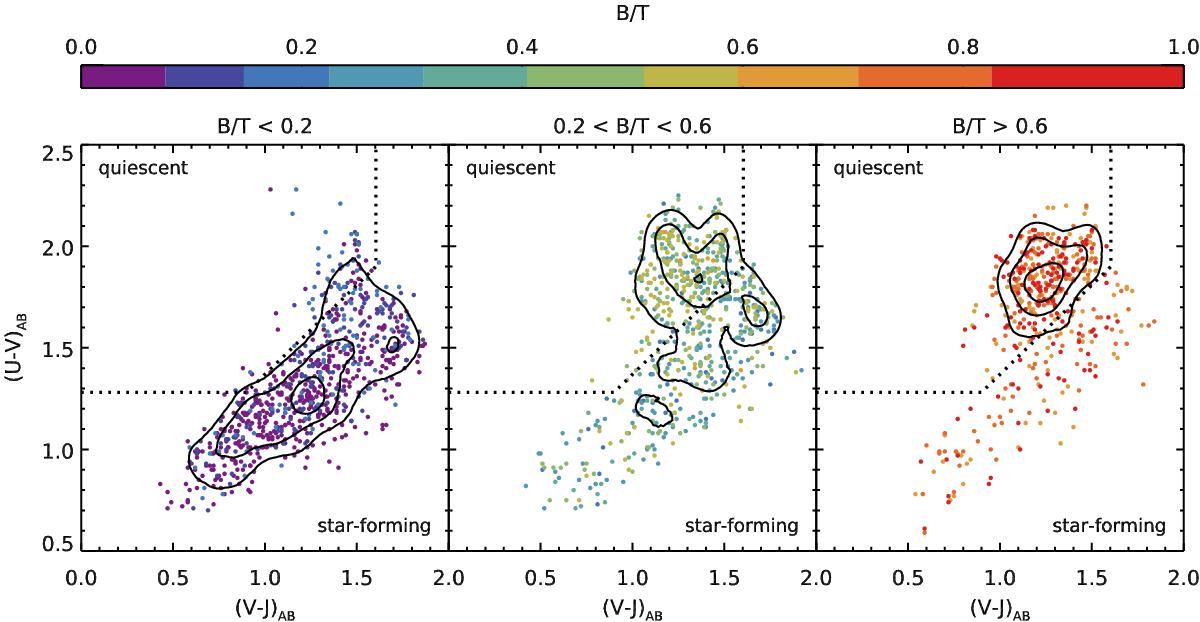
Location of galaxies from the H sample with varying mass-weighted B/T on the UVJ diagram (left: B/T< 0.2, middle: 0.2 <B/T< 0.6, right: B/T> 0.6), using the total magnitudes of each galaxy. The dotted line shows the dividing line between the star-forming and quiescent populations defined in Eq. (1). It is clear that both bulge- and disk-dominated galaxies occupy very different regions of the diagram, illustrating the good agreement between the colors and morphology. Intermediate galaxies with roughly equal mass in the disk and bulge (middle panel, ⟨B/T⟩ = 0.4) are spread over the two regions, with a tendency for being preferentially in the quiescent region.
Current usage metrics show cumulative count of Article Views (full-text article views including HTML views, PDF and ePub downloads, according to the available data) and Abstracts Views on Vision4Press platform.
Data correspond to usage on the plateform after 2015. The current usage metrics is available 48-96 hours after online publication and is updated daily on week days.
Initial download of the metrics may take a while.