Fig. 4
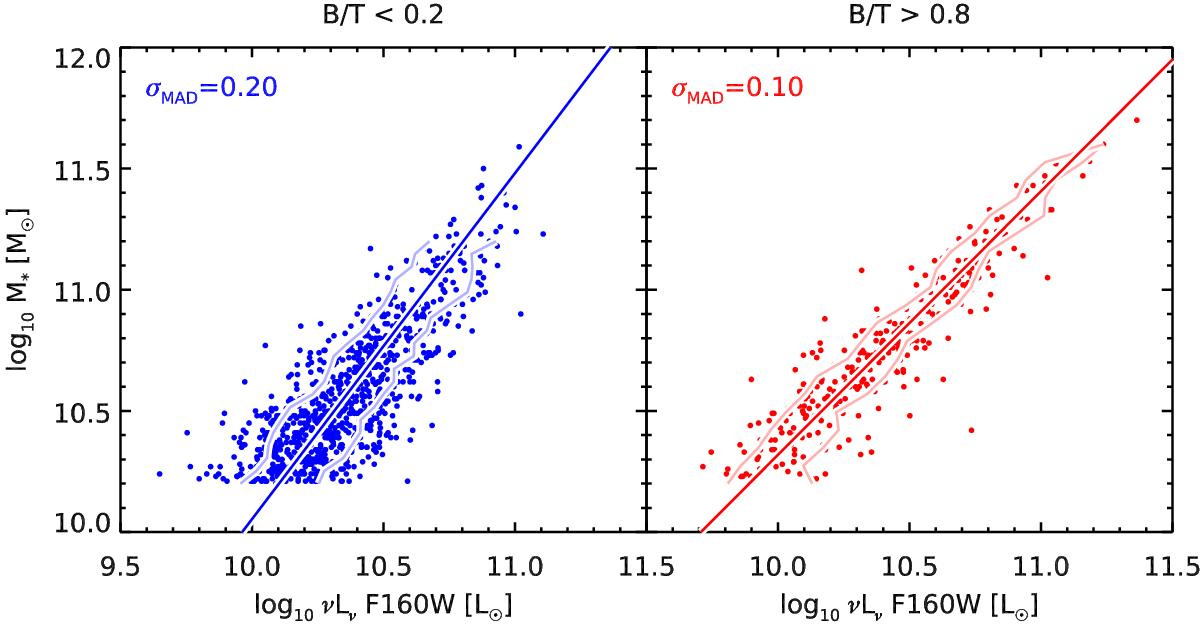
Relation between the total stellar mass (M∗) estimated by fitting the integrated multi-wavelength photometry of the whole galaxy and the measured luminosity from the HST H-band flux (without k-correction) for a sample of disk-dominated (B/T< 0.2, left) and bulge-dominated galaxies (B/T> 0.8, right). Individual galaxies are shown with filled colored circles. The best-fit relation is shown with a straight line, and the dispersion around this relation is shown with light solid lines on each side. The global dispersion is given in the top left corner of each plot and is computed from the median absolute deviation (MAD) using 1.48 × MAD(ΔM∗).
Current usage metrics show cumulative count of Article Views (full-text article views including HTML views, PDF and ePub downloads, according to the available data) and Abstracts Views on Vision4Press platform.
Data correspond to usage on the plateform after 2015. The current usage metrics is available 48-96 hours after online publication and is updated daily on week days.
Initial download of the metrics may take a while.