Fig. 2
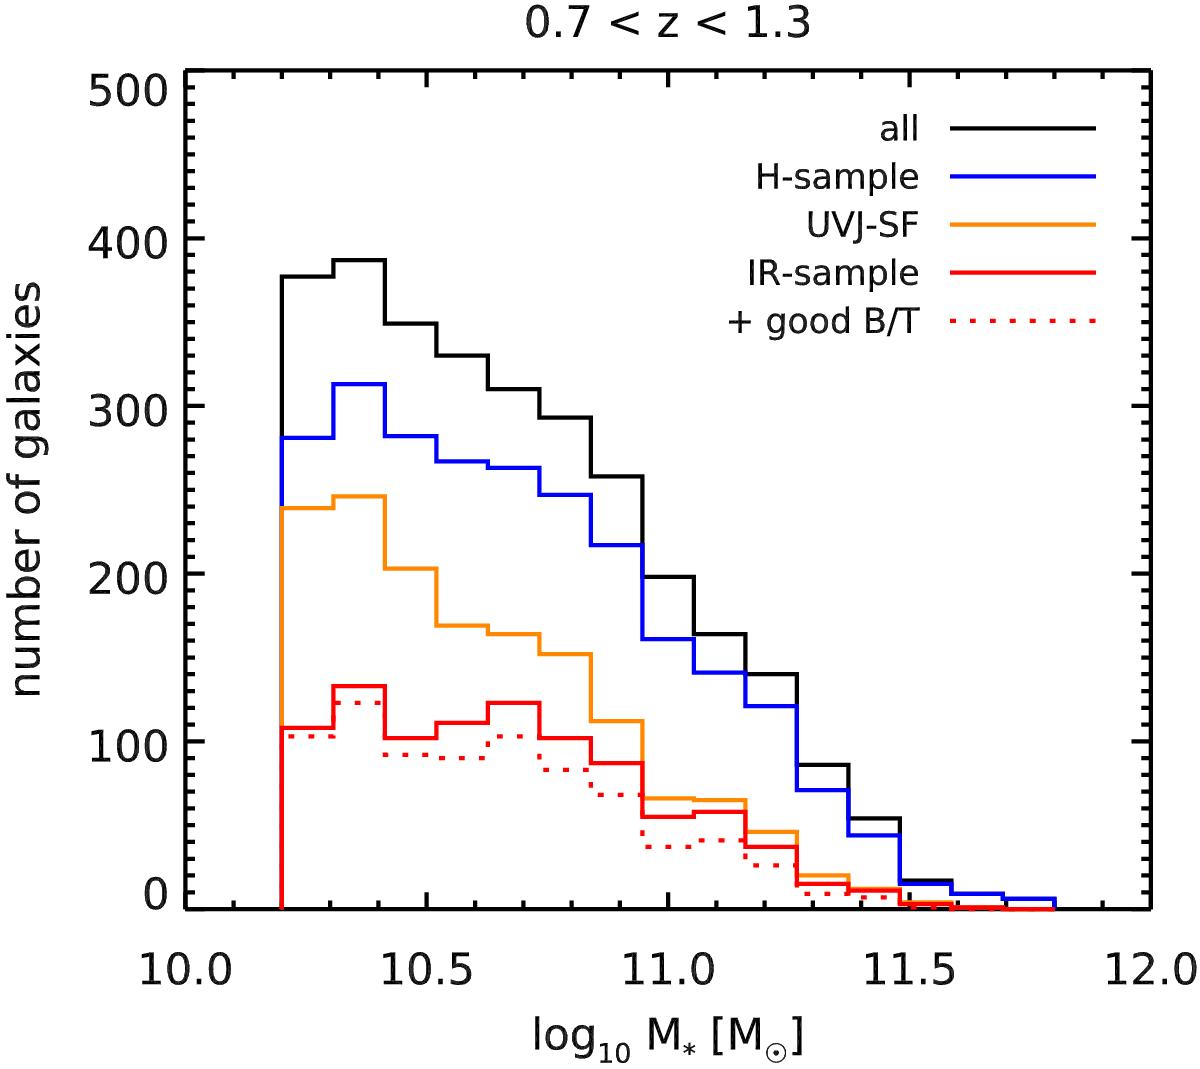
Stellar mass distribution of the various samples at z = 1 that we consider for the morphological decomposition (Sect. 2.3). Each line corresponds to a step of the selection process, progressively decreasing the number of objects in the sample as in Table 1. The black solid line shows the distribution of our parent sample, containing all the galaxies at 0.7 <z< 1.3 with M∗> 2 × 10¹⁰ M⊙ and accurate determination of both redshift and stellar mass. The blue solid line is our H-sample, after removing close pairs and IRAC power-law AGNs from the parent sample. The orange solid line shows galaxies in the H-sample that are classified as UVJ star-forming (Eq. (1)). The red solid line is our IR-sample of galaxies with a MIR or FIR detection. Finally, the dotted line indicates the number of those galaxies for which we can reliably decompose the light profile.
Current usage metrics show cumulative count of Article Views (full-text article views including HTML views, PDF and ePub downloads, according to the available data) and Abstracts Views on Vision4Press platform.
Data correspond to usage on the plateform after 2015. The current usage metrics is available 48-96 hours after online publication and is updated daily on week days.
Initial download of the metrics may take a while.