Free Access
Fig. B.1
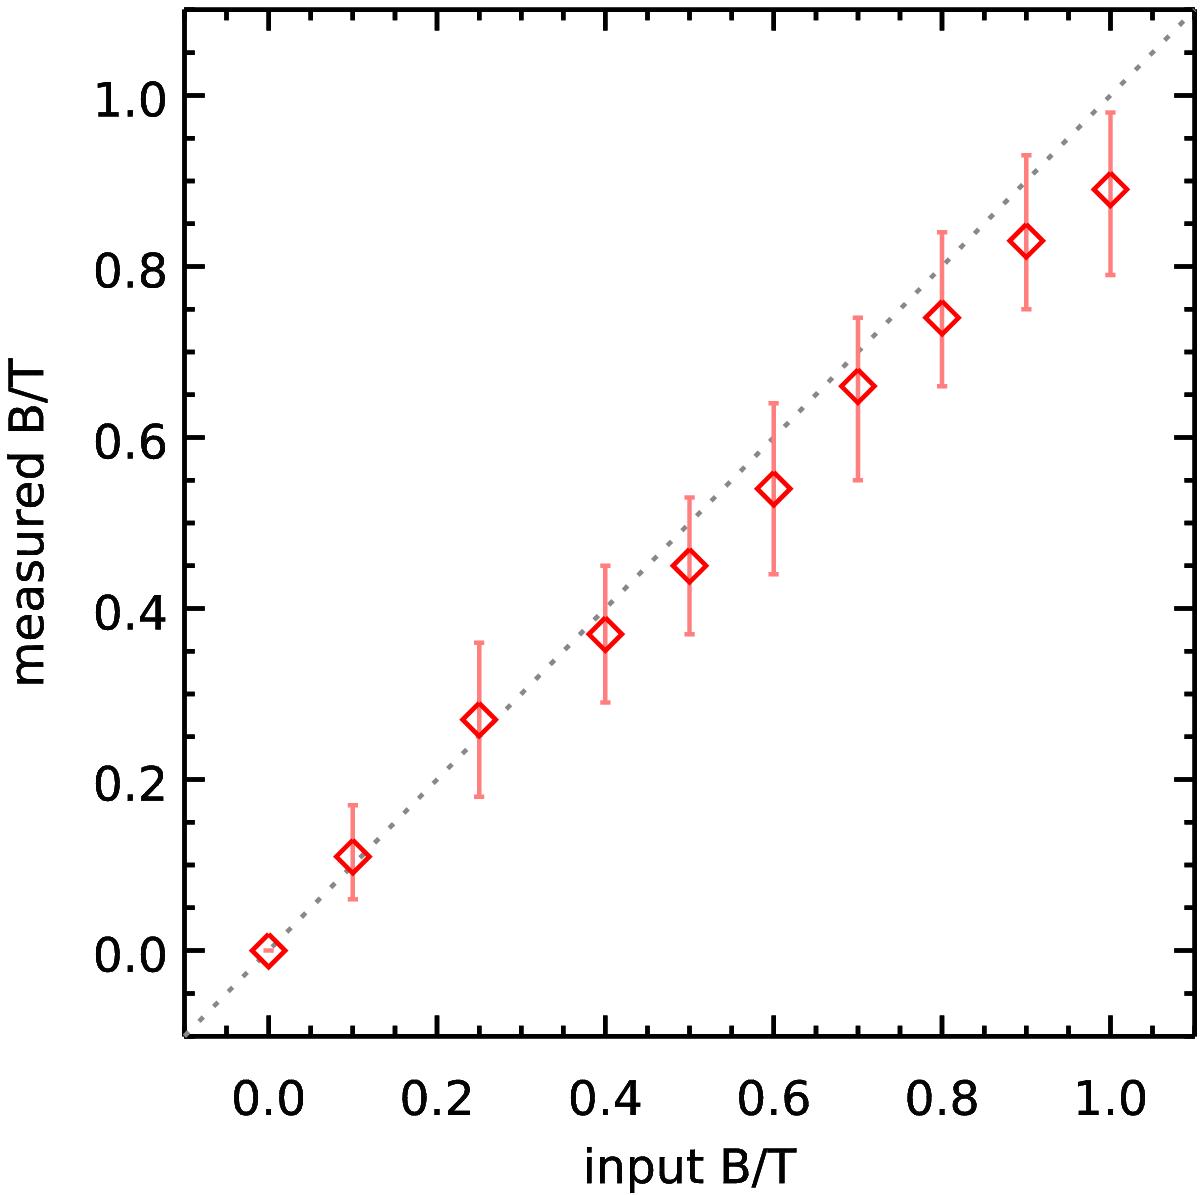
Comparison between the simulated B/T and that measured by GIM2D for galaxies with H< 22.5. The median measured B/T are shown with empty red diamonds and the error bars give the 16th and 84th percentiles of the distribution. The dotted line in the background gives the expected one-to-one relation.
Current usage metrics show cumulative count of Article Views (full-text article views including HTML views, PDF and ePub downloads, according to the available data) and Abstracts Views on Vision4Press platform.
Data correspond to usage on the plateform after 2015. The current usage metrics is available 48-96 hours after online publication and is updated daily on week days.
Initial download of the metrics may take a while.