Fig. 12
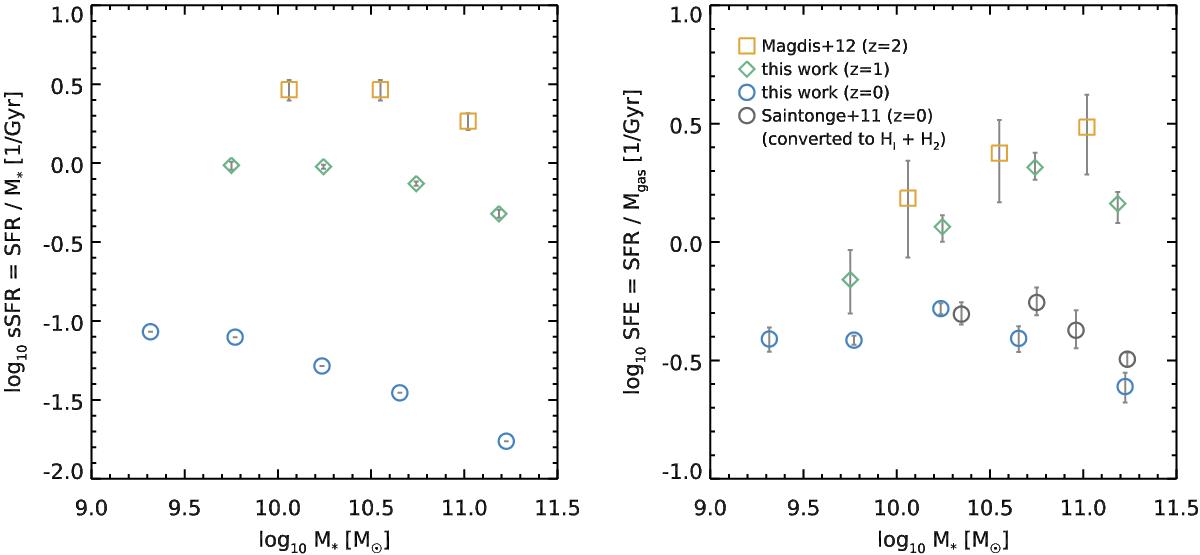
Left: relation between the specific SFR (sSFR = SFR/M∗) and the stellar mass (M∗) at various redshifts. Our z = 1 stacked measurements from S15 are shown with empty diamonds, and the average values of the star-forming HRS galaxies are shown with empty circles. The associated error bar is the error on the mean, not the dispersion of the sample. We compare these measurements to the z = 2 values obtained by Magdis et al. (2012) for star-forming BzK galaxies. Right: same as left, but replacing the sSFR by the star formation efficiency (SFE = SFR/Mgas). The diamonds and circles use the gas mass estimated in this paper, while the empty squares come from Magdis et al. (2012) and were computed with the same method. We also show for reference the measurements of Saintonge et al. (2011b) with empty gray circles. Their study only included H2 in Mgas, therefore we rescaled their measurement to include H i assuming Rmol = log 10(MH2/MH i) = 0.425 (log 10(M∗/M⊙)−10.7)−0.387 (Saintonge et al. 2011a, Fig. 9 and Table 4). We also caution that the sample selection in Saintonge et al. (2011b) is different from ours.
Current usage metrics show cumulative count of Article Views (full-text article views including HTML views, PDF and ePub downloads, according to the available data) and Abstracts Views on Vision4Press platform.
Data correspond to usage on the plateform after 2015. The current usage metrics is available 48-96 hours after online publication and is updated daily on week days.
Initial download of the metrics may take a while.