Fig. 10
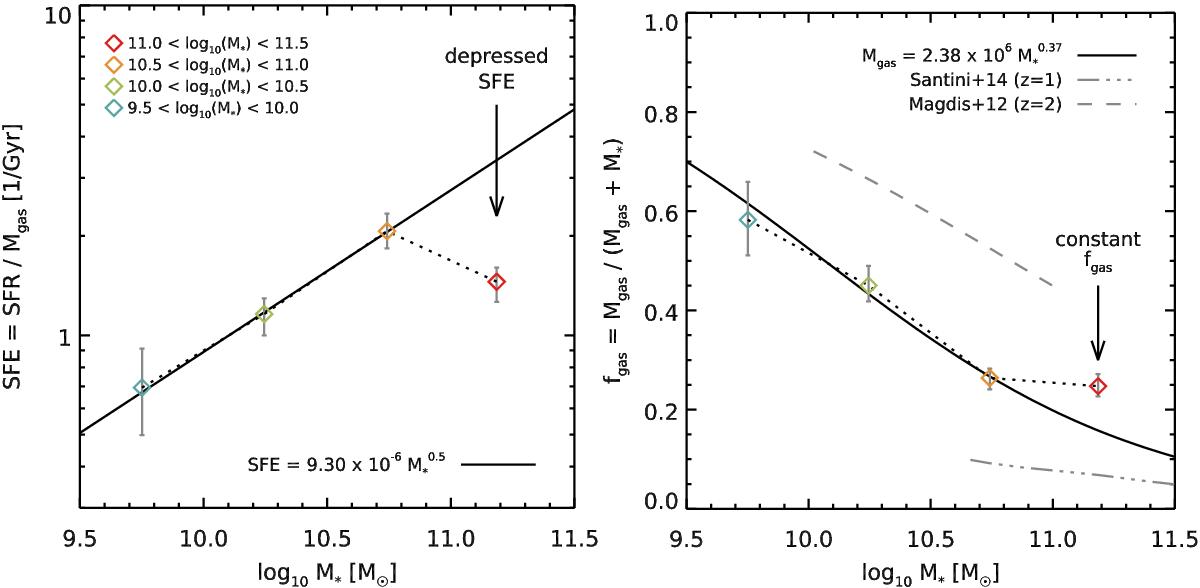
Left: relation between the SFE = SFR/Mgas and the stellar mass (M∗) for main-sequence galaxies at z = 1. Colored diamonds show the measured SFEs and M∗ of our stacked sample, the color being associated with the stellar mass as in Fig. 6. The best-fit power law to our measurements, excluding the most massive point, is given with a black solid line (Eq. (9)). Right: gas fraction (fgas ≡ Mgas/ (Mgas + M∗)) as a function of the stellar mass (M∗) for main-sequence galaxies at z = 1. The legend is the same as in the left figure, and here the solid black line gives the value of fgas computed using the best-fit Mgas − M∗ relation, also excluding the most massive point in the fit. The resulting expression of fgas is given in Eq. (10). We also show the measured gas fractions by Magdis et al. (2012) at z = 2 with a dashed gray line and by Santini et al. (2014) at z = 1 with a dot-dashed gray line.
Current usage metrics show cumulative count of Article Views (full-text article views including HTML views, PDF and ePub downloads, according to the available data) and Abstracts Views on Vision4Press platform.
Data correspond to usage on the plateform after 2015. The current usage metrics is available 48-96 hours after online publication and is updated daily on week days.
Initial download of the metrics may take a while.