Fig. 1
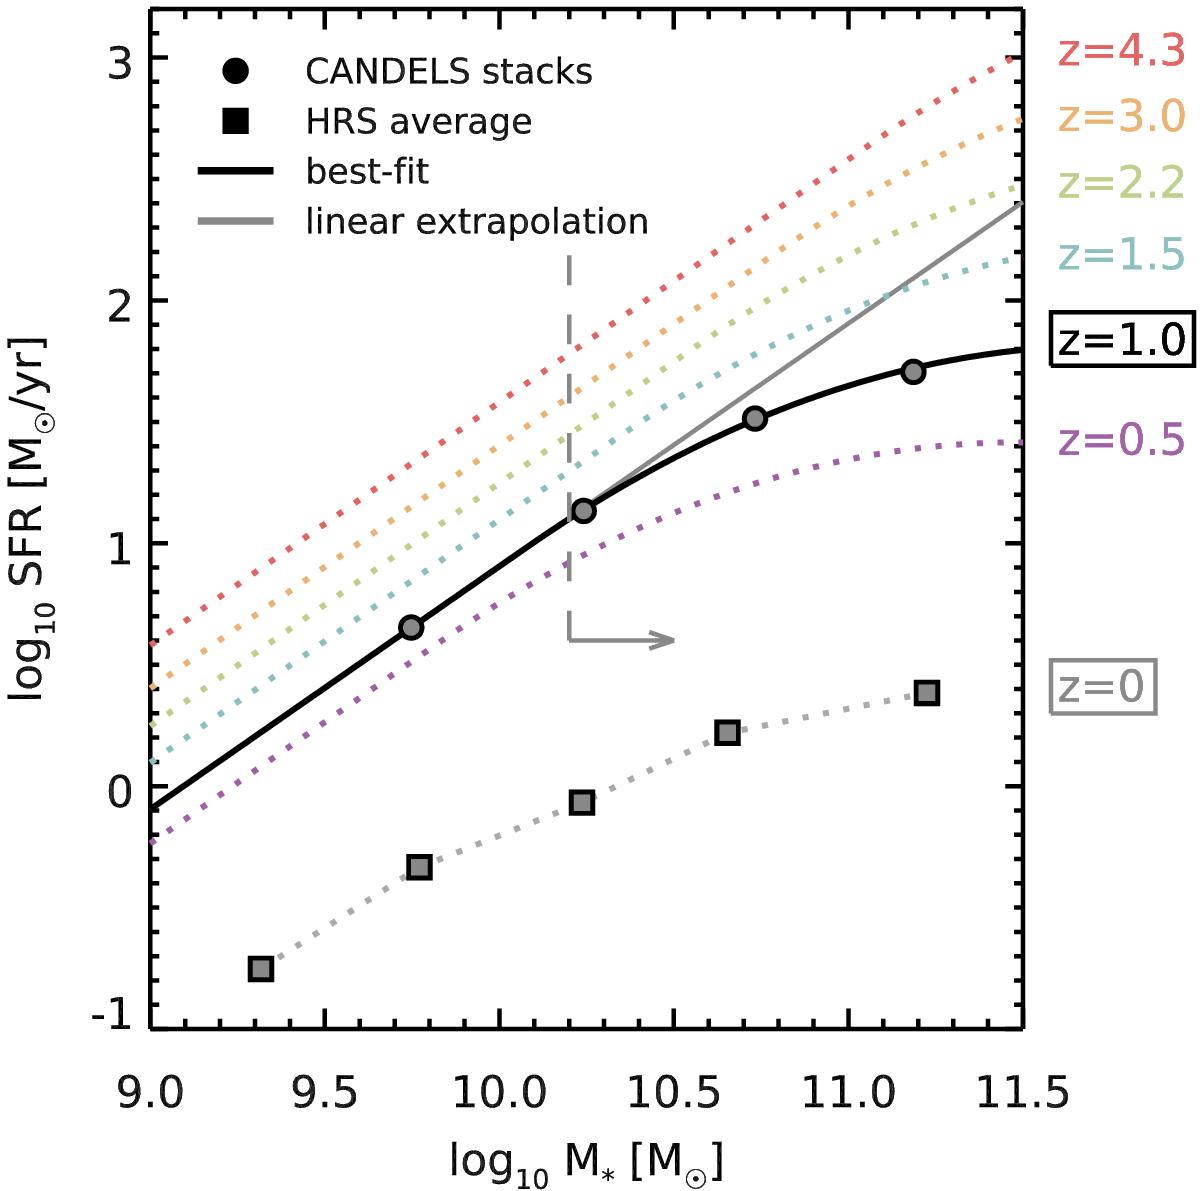
Main sequence of star-forming galaxies at different redshifts. Solid circles and fits (solid black line and dotted colored lines) are taken from S15. Statistical error bars are smaller than the symbols. We here focus on a redshift range centered on z = 1, which is highlighted in this plot. There, to illustrate the change of slope of the main sequence, we show as a gray solid line the extrapolation of the low-mass sSFR ≡ SFR /M∗, with a slope of unity. The gray dashed line and the arrow indicate the region of this diagram within which we perform the morphological decomposition of the HST light profiles of z = 1 galaxies (Sect. 2.3). We also show for reference the main sequence as seen in the Herschel Reference Survey at z = 0 (see Ciesla et al. 2016).
Current usage metrics show cumulative count of Article Views (full-text article views including HTML views, PDF and ePub downloads, according to the available data) and Abstracts Views on Vision4Press platform.
Data correspond to usage on the plateform after 2015. The current usage metrics is available 48-96 hours after online publication and is updated daily on week days.
Initial download of the metrics may take a while.