Fig. 5
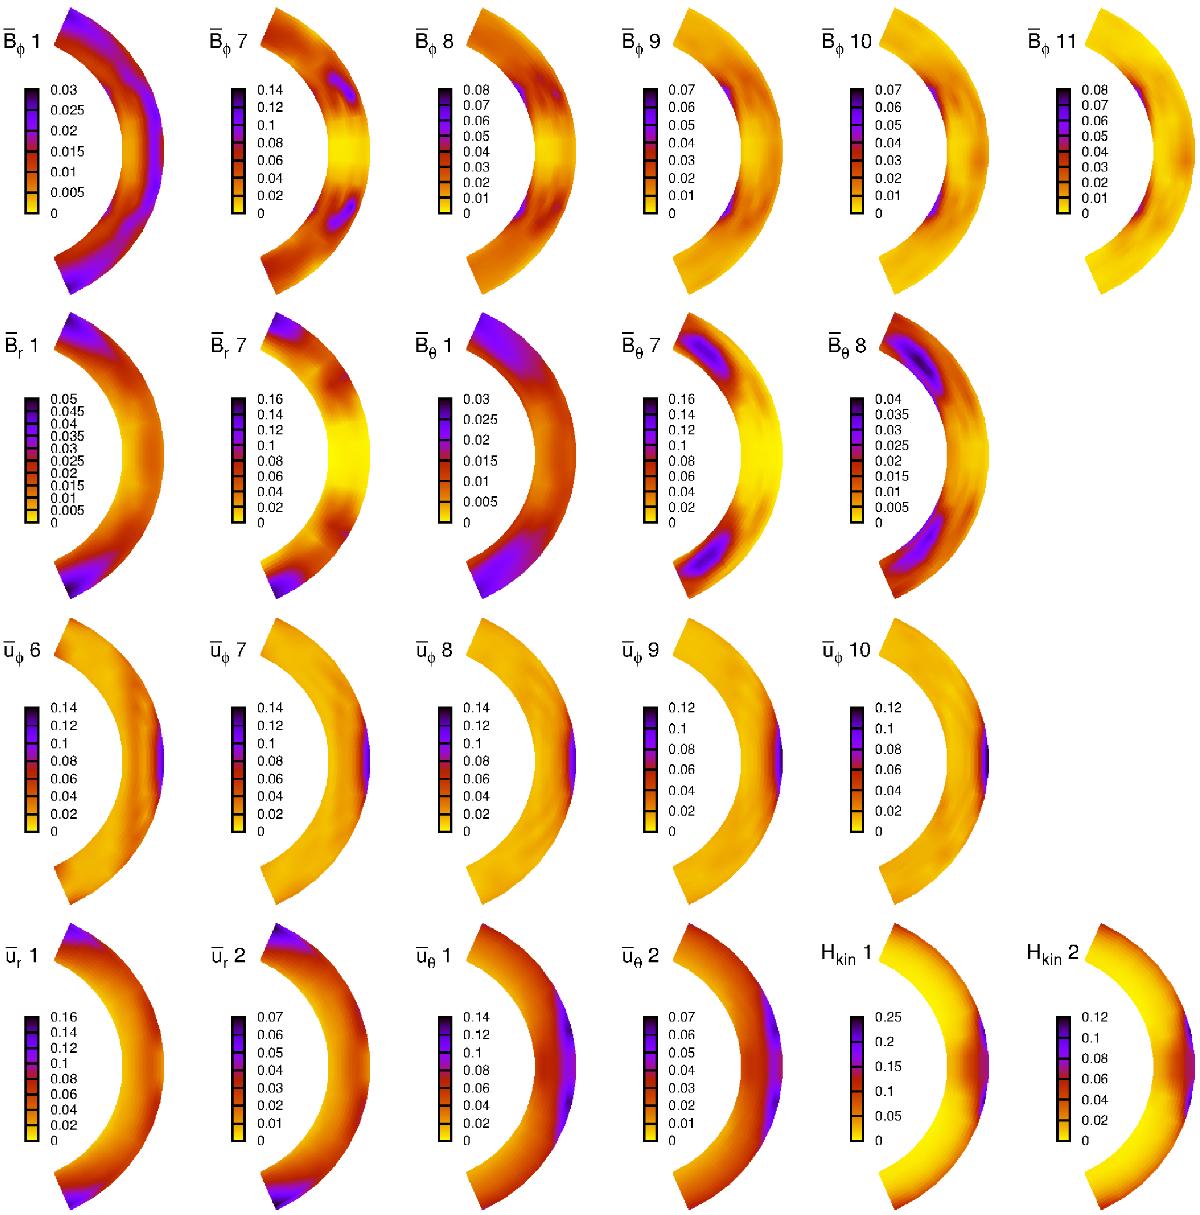
Distribution of mean amplitudes of the most significant modes of mean magnetic and mean velocity fields found from EEMD. The figures are labeled with the physical variable followed by mode index (e.g. ![]() 7 indicates mode 7 of the mean latitudinal magnetic field). Colors reflect the mean amplitude (blue − high, yellow − low) of the mode at the given location; we note that the scales of separate figures are different. Contours on the plot represent the lines of constant amplitude with values given in the legend.
7 indicates mode 7 of the mean latitudinal magnetic field). Colors reflect the mean amplitude (blue − high, yellow − low) of the mode at the given location; we note that the scales of separate figures are different. Contours on the plot represent the lines of constant amplitude with values given in the legend.
Current usage metrics show cumulative count of Article Views (full-text article views including HTML views, PDF and ePub downloads, according to the available data) and Abstracts Views on Vision4Press platform.
Data correspond to usage on the plateform after 2015. The current usage metrics is available 48-96 hours after online publication and is updated daily on week days.
Initial download of the metrics may take a while.