Fig. 4
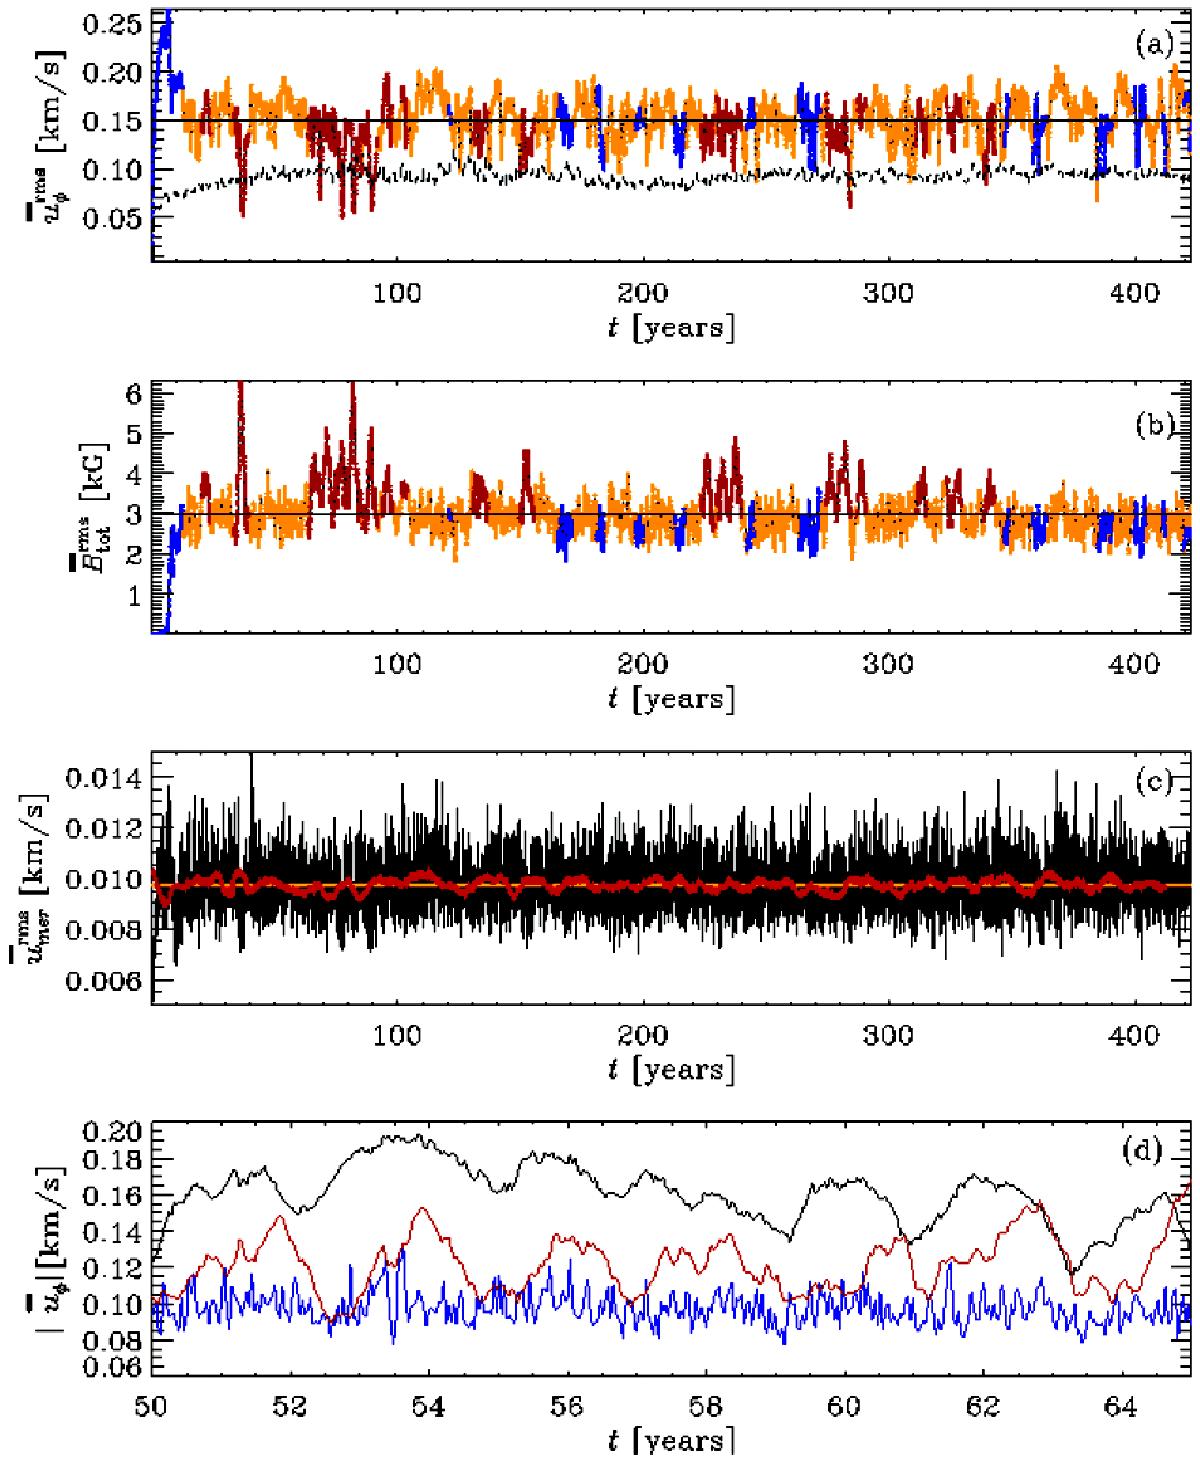
a) Rms value of the mean azimuthal velocity as a function of time together with the average over the whole time series plotted with a black horizontal line. The dashed black line shows the volume-averaged rms value of the fluctuating velocity field, urms. The times considered “high” are indicated in red, “low” in blue, and “nominal” activity states according to the strength of the total magnetic field in orange (D1, see Sect. 4.4). b) As in a), but for the rms value of the total magnetic field as a function of time. The black horizontal line indicates the mean over the whole time series. c) Rms value of the meridional velocity as a function of time (black solid line) with the mean over the whole time series (orange horizontal line) and a 4.9-year moving average (thick red solid line). d) Zoom-in to 50−65 years of evolution of the mean azimuthal velocity (black solid), mean meridional velocity (blue line, multiplied by a factor of 10 to fit the figure), and the total mean magnetic field strength (red line, scaled to fit the figure).
Current usage metrics show cumulative count of Article Views (full-text article views including HTML views, PDF and ePub downloads, according to the available data) and Abstracts Views on Vision4Press platform.
Data correspond to usage on the plateform after 2015. The current usage metrics is available 48-96 hours after online publication and is updated daily on week days.
Initial download of the metrics may take a while.