Fig. 10

a) Time-latitude plot of the kinetic helicity variations ![]() . Zoomed-in plots of
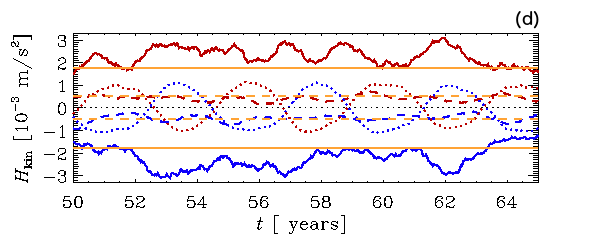
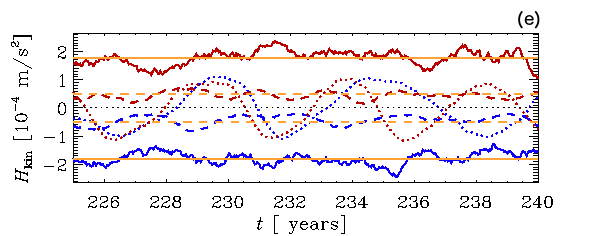
. Zoomed-in plots of ![]() over t = 50−65 yrsb) and t = 225−240 yrsc). d) Hkin at ±10° (solid) and ± 25° (dashed) latitude for north (blue) and south (red) with the means over the whole time series indicated with an orange horizontal line. The data is averaged with a running mean over a 1-year window, to smooth out the dominant high-frequency component. The dotted lines show the radial magnetic field at ± 25° latitude, scaled to fit the plot. All quantities are plotted at Rs.
over t = 50−65 yrsb) and t = 225−240 yrsc). d) Hkin at ±10° (solid) and ± 25° (dashed) latitude for north (blue) and south (red) with the means over the whole time series indicated with an orange horizontal line. The data is averaged with a running mean over a 1-year window, to smooth out the dominant high-frequency component. The dotted lines show the radial magnetic field at ± 25° latitude, scaled to fit the plot. All quantities are plotted at Rs.
Current usage metrics show cumulative count of Article Views (full-text article views including HTML views, PDF and ePub downloads, according to the available data) and Abstracts Views on Vision4Press platform.
Data correspond to usage on the plateform after 2015. The current usage metrics is available 48-96 hours after online publication and is updated daily on week days.
Initial download of the metrics may take a while.