Fig. 9
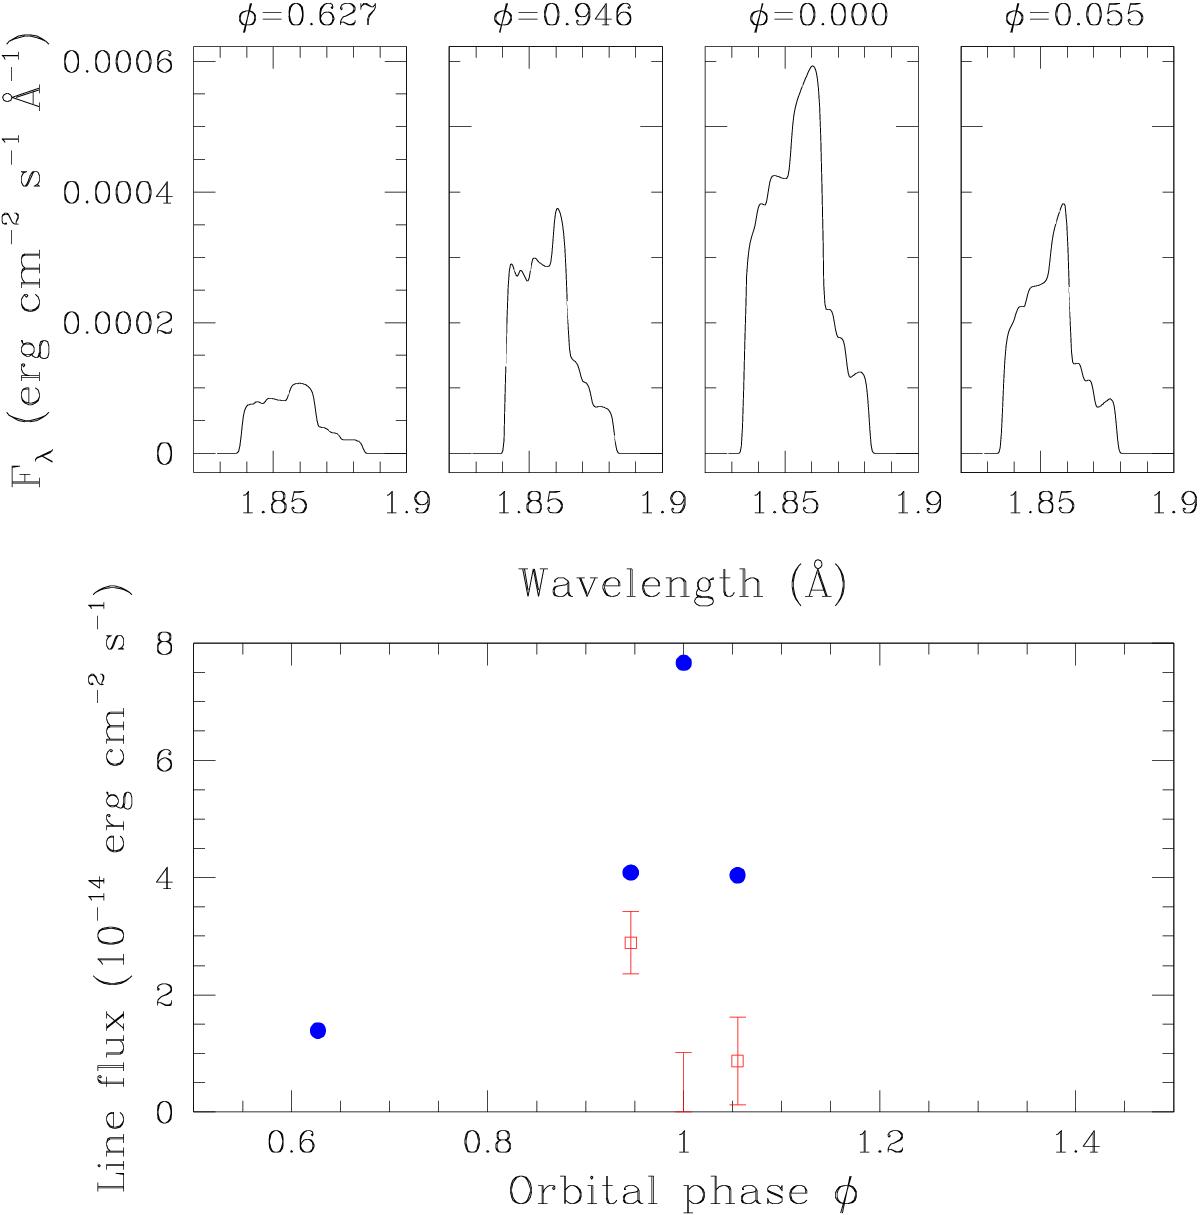
Top row: synthetic profiles of the Fe xxv line blend as predicted by the model of Rauw et al. (2016, see also text). Bottom: variation of the integrated fluxes of the synthetic line profiles (filled symbols) as a function of orbital phase. The synthetic fluxes were scaled to match the observed emission measure of the hard plasma component at φ = 0.000. The measured fluxes at φ = 0.946 and 0.055 are shown by the open symbols. An upper limit on the flux at φ = 0.000 is also shown.
Current usage metrics show cumulative count of Article Views (full-text article views including HTML views, PDF and ePub downloads, according to the available data) and Abstracts Views on Vision4Press platform.
Data correspond to usage on the plateform after 2015. The current usage metrics is available 48-96 hours after online publication and is updated daily on week days.
Initial download of the metrics may take a while.