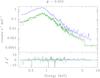
Fig. 6
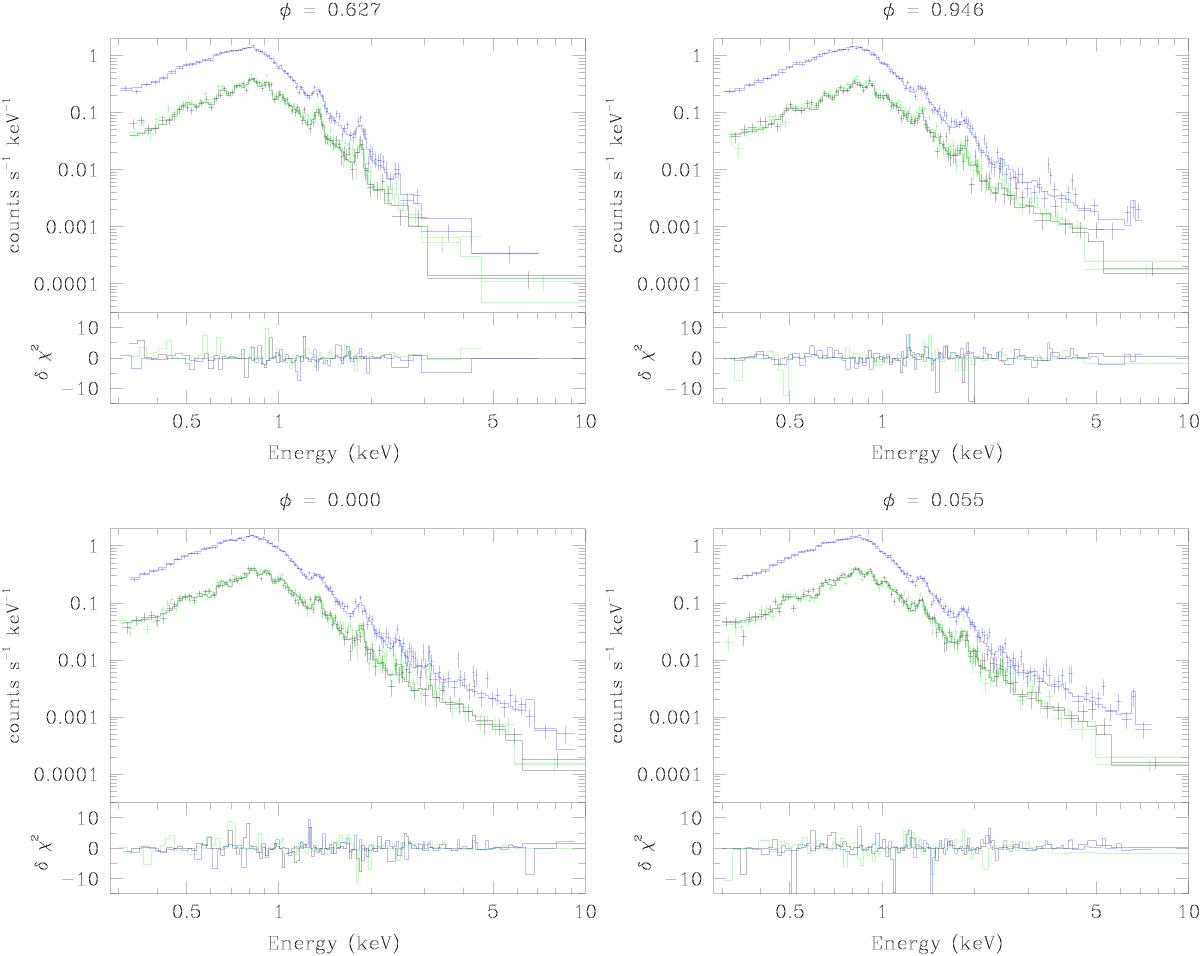
EPIC spectra of 9 Sgr as a function of orbital phase along with the best-fit thermal non-equilibrium (Eq. (4)) models. The top panels illustrate the EPIC-pn (blue), EPIC-MOS1 (black), and EPIC-MOS2 (green) data. The bottom panels yield the contributions of the different energy bins to the χ2 of the fit, with the sign of δχ2 being defined as the sign of the observation minus the model. All panels have the same vertical and horizontal scales. We note the relatively constant flux level in the soft part of the spectrum, but also the strong changes in the level of the hard flux between φ = 0.627 and the spectra taken close to periastron.
Current usage metrics show cumulative count of Article Views (full-text article views including HTML views, PDF and ePub downloads, according to the available data) and Abstracts Views on Vision4Press platform.
Data correspond to usage on the plateform after 2015. The current usage metrics is available 48-96 hours after online publication and is updated daily on week days.
Initial download of the metrics may take a while.