Free Access
Fig. 5
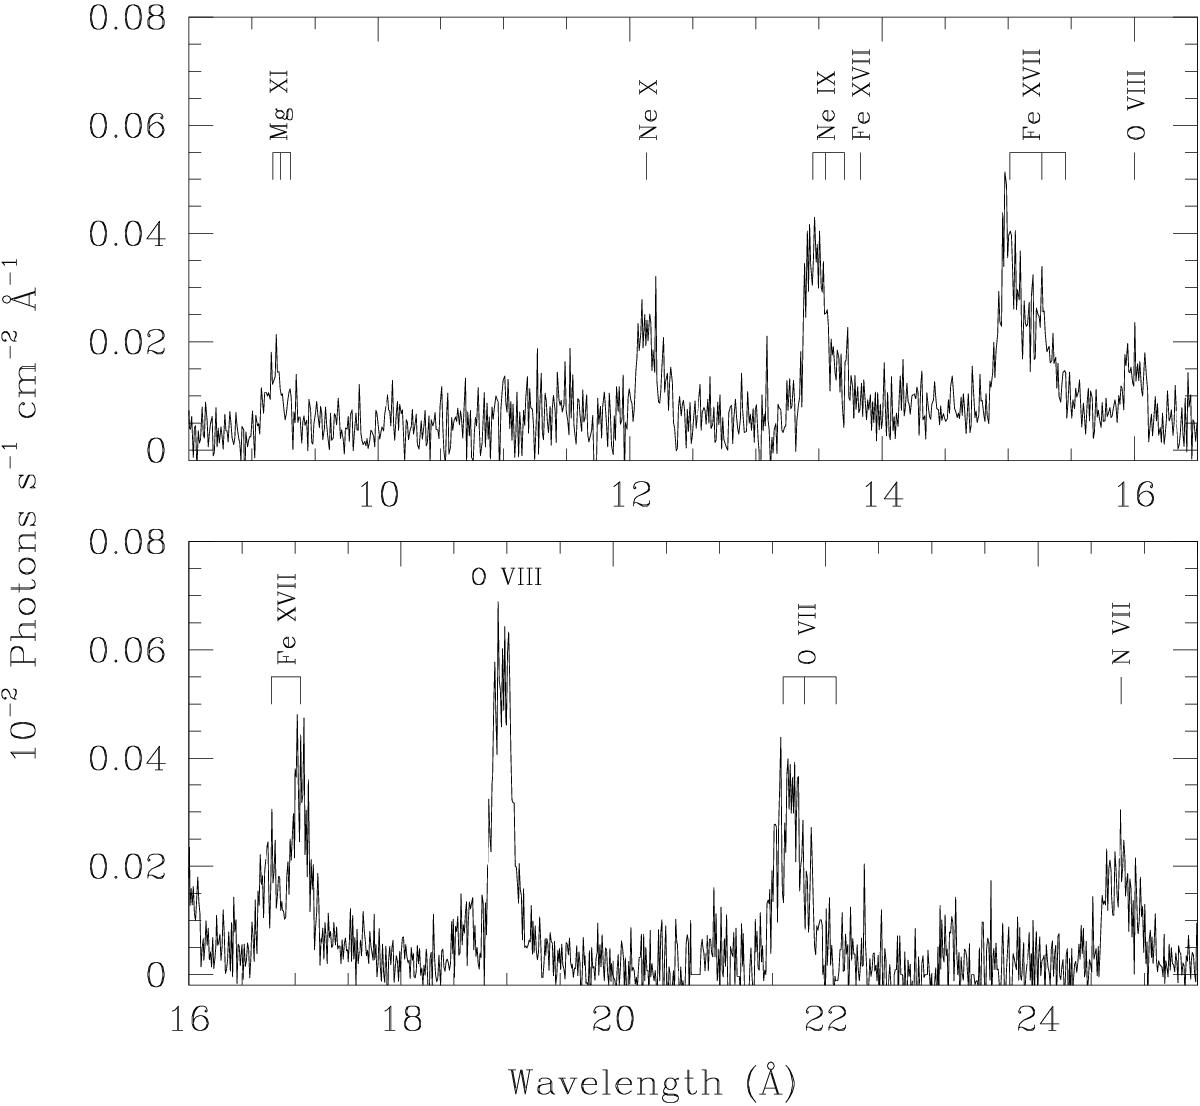
Combined RGS spectrum (including first and second orders of RGS1 and RGS2) of all four X-ray observations. The most important spectral lines are identified by the labels.
Current usage metrics show cumulative count of Article Views (full-text article views including HTML views, PDF and ePub downloads, according to the available data) and Abstracts Views on Vision4Press platform.
Data correspond to usage on the plateform after 2015. The current usage metrics is available 48-96 hours after online publication and is updated daily on week days.
Initial download of the metrics may take a while.