Fig. 1
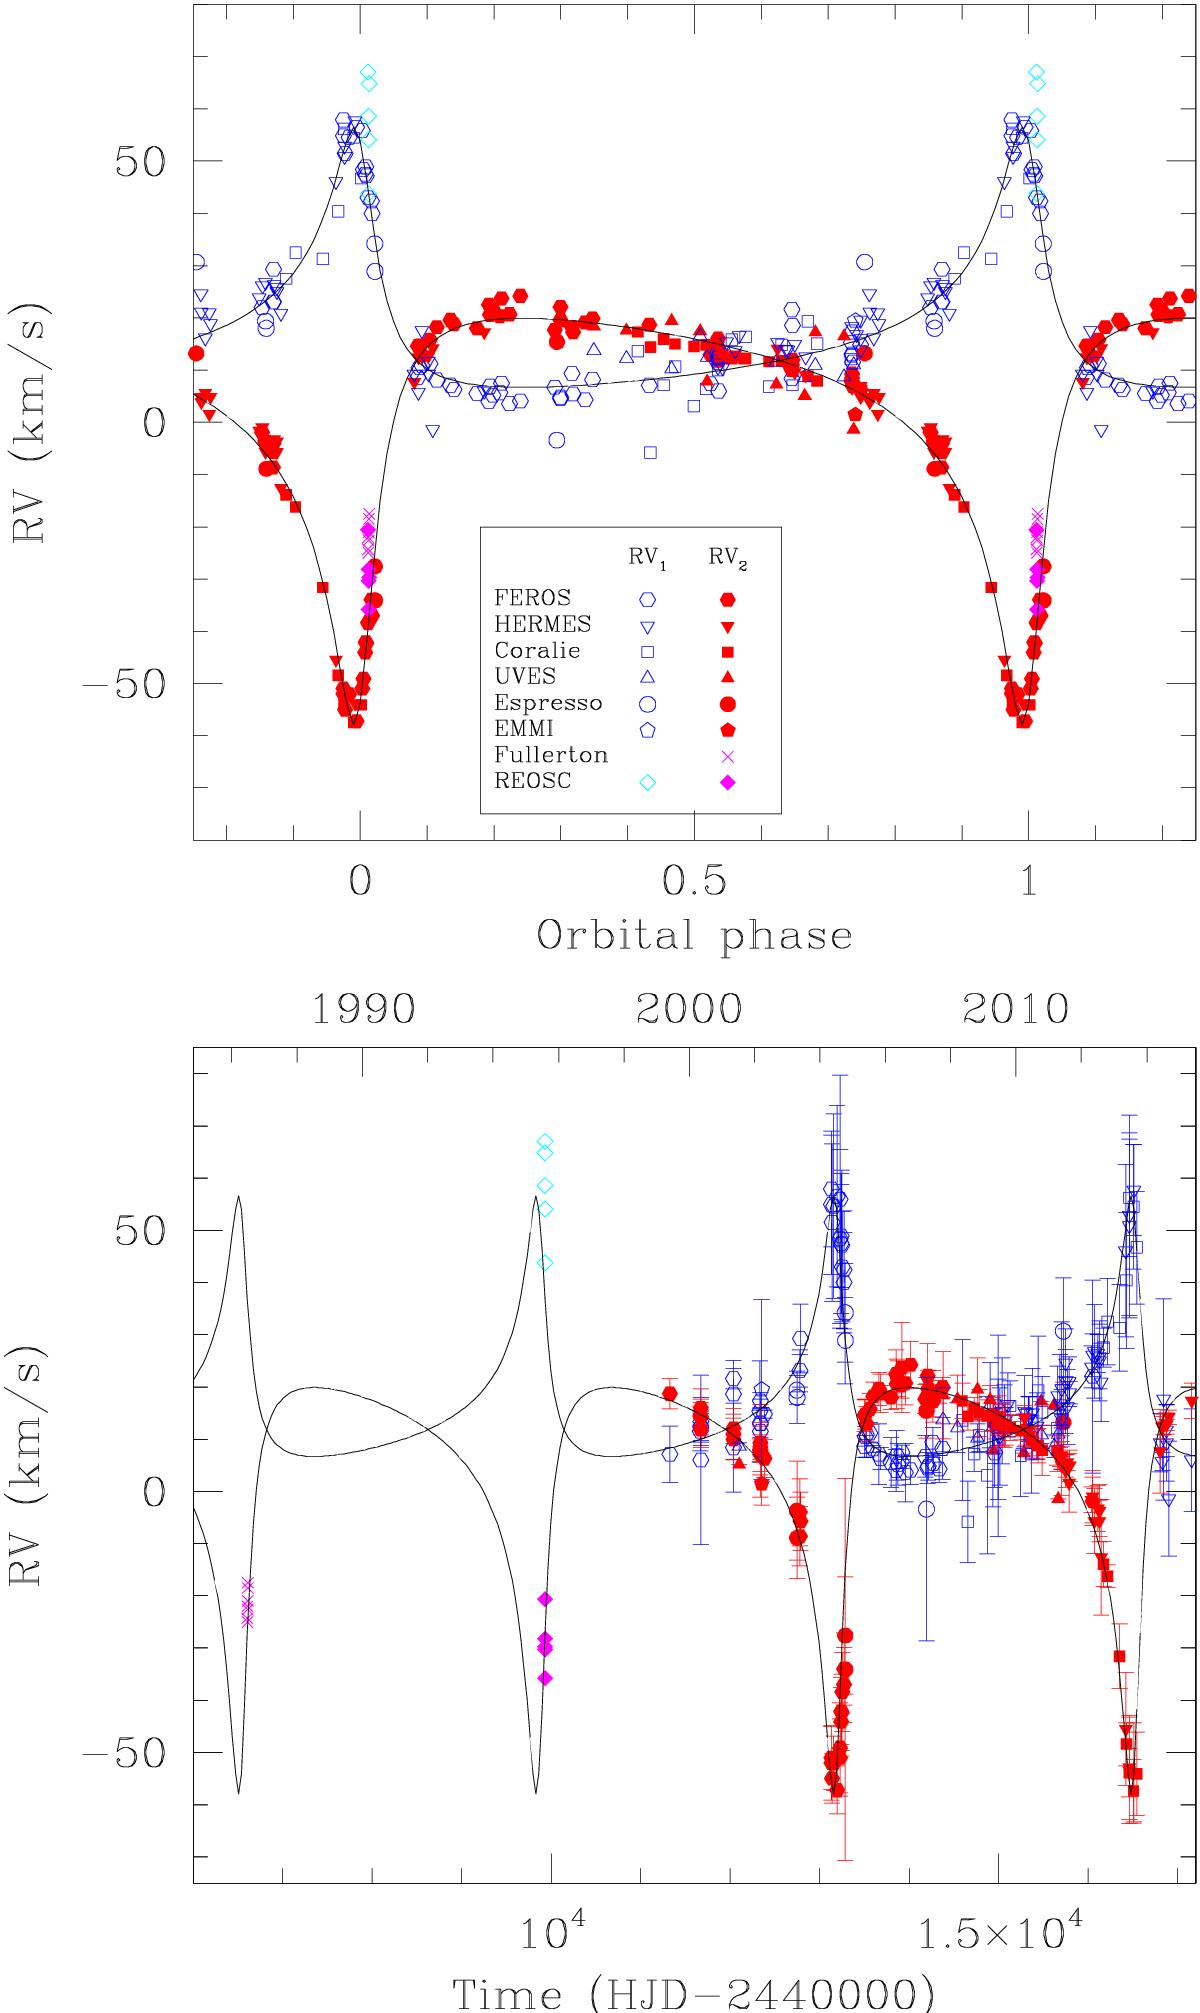
Radial velocity curve of 9 Sgr. Open and filled symbols stand for the RVs of the primary and secondary, respectively. The various symbols refer to data obtained with different instruments. The RVs from Fullerton (1990) refer only to the secondary star and therefore were not included in the computation of the SB2 orbital solution. The top panel shows the RV curve folded in orbital phase, whilst the lower panel illustrates the distribution as a function of time (given in years on the top axis and as HJD − 2 440 000 on the bottom axis).
Current usage metrics show cumulative count of Article Views (full-text article views including HTML views, PDF and ePub downloads, according to the available data) and Abstracts Views on Vision4Press platform.
Data correspond to usage on the plateform after 2015. The current usage metrics is available 48-96 hours after online publication and is updated daily on week days.
Initial download of the metrics may take a while.