Fig. 8
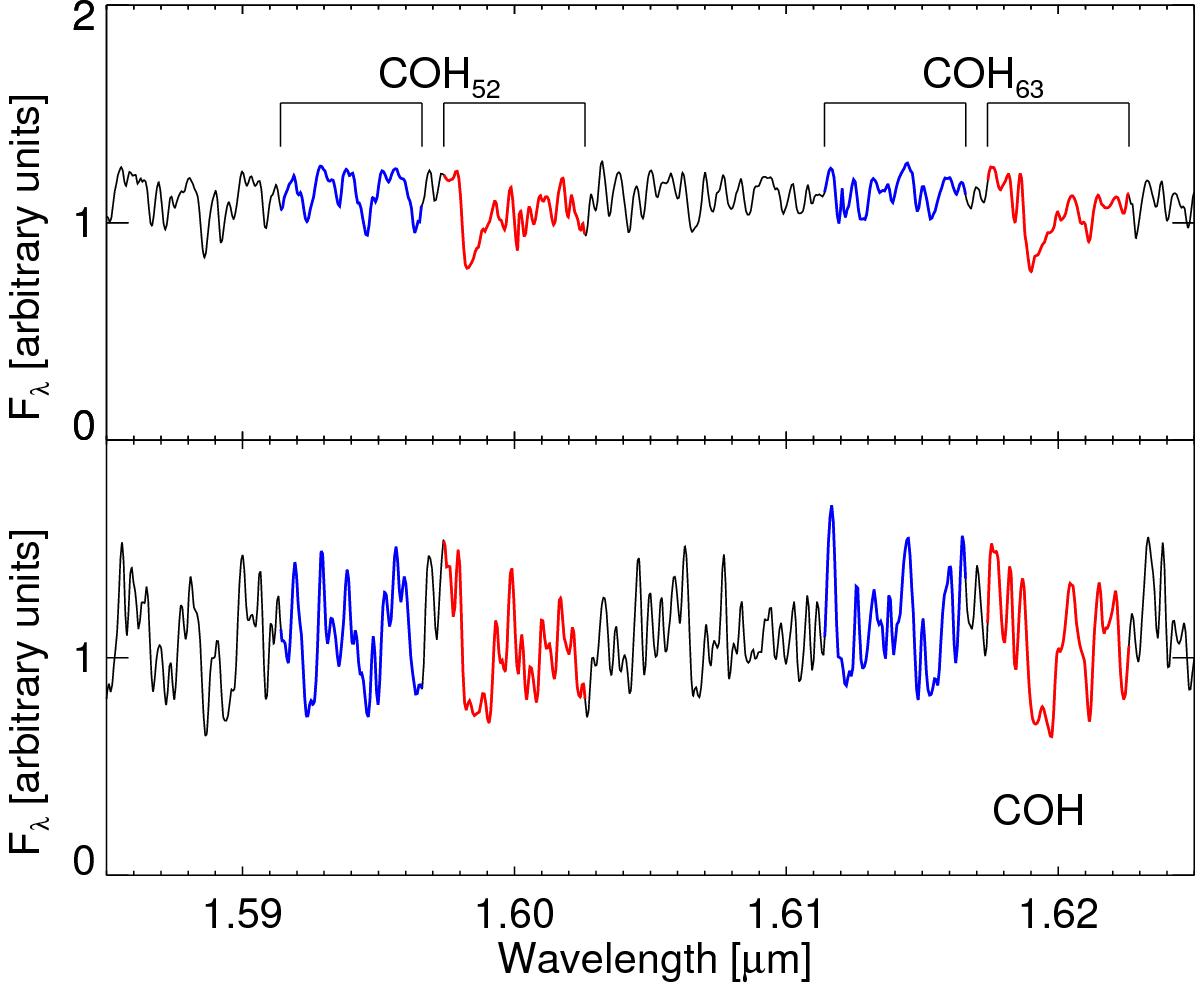
Zoom into the 12CO(6, 3) line near 1.62 μm. The red lines indicate the features regions, while the blue measure the continuum. The upper panel shows the spectrum of a carbon star, Cl* NGC 121 T V8, in which the 12CO(5, 2) and 12CO(6, 3) bands are visible. The lower panel corresponds to another carbon star, 2MASS J00571214-7307045, in which the CN and C2 lines are more prominent and overlap with the CO lines. The spectra have been normalized at 1.62 μm for display purposes.
Current usage metrics show cumulative count of Article Views (full-text article views including HTML views, PDF and ePub downloads, according to the available data) and Abstracts Views on Vision4Press platform.
Data correspond to usage on the plateform after 2015. The current usage metrics is available 48-96 hours after online publication and is updated daily on week days.
Initial download of the metrics may take a while.