Fig. 5
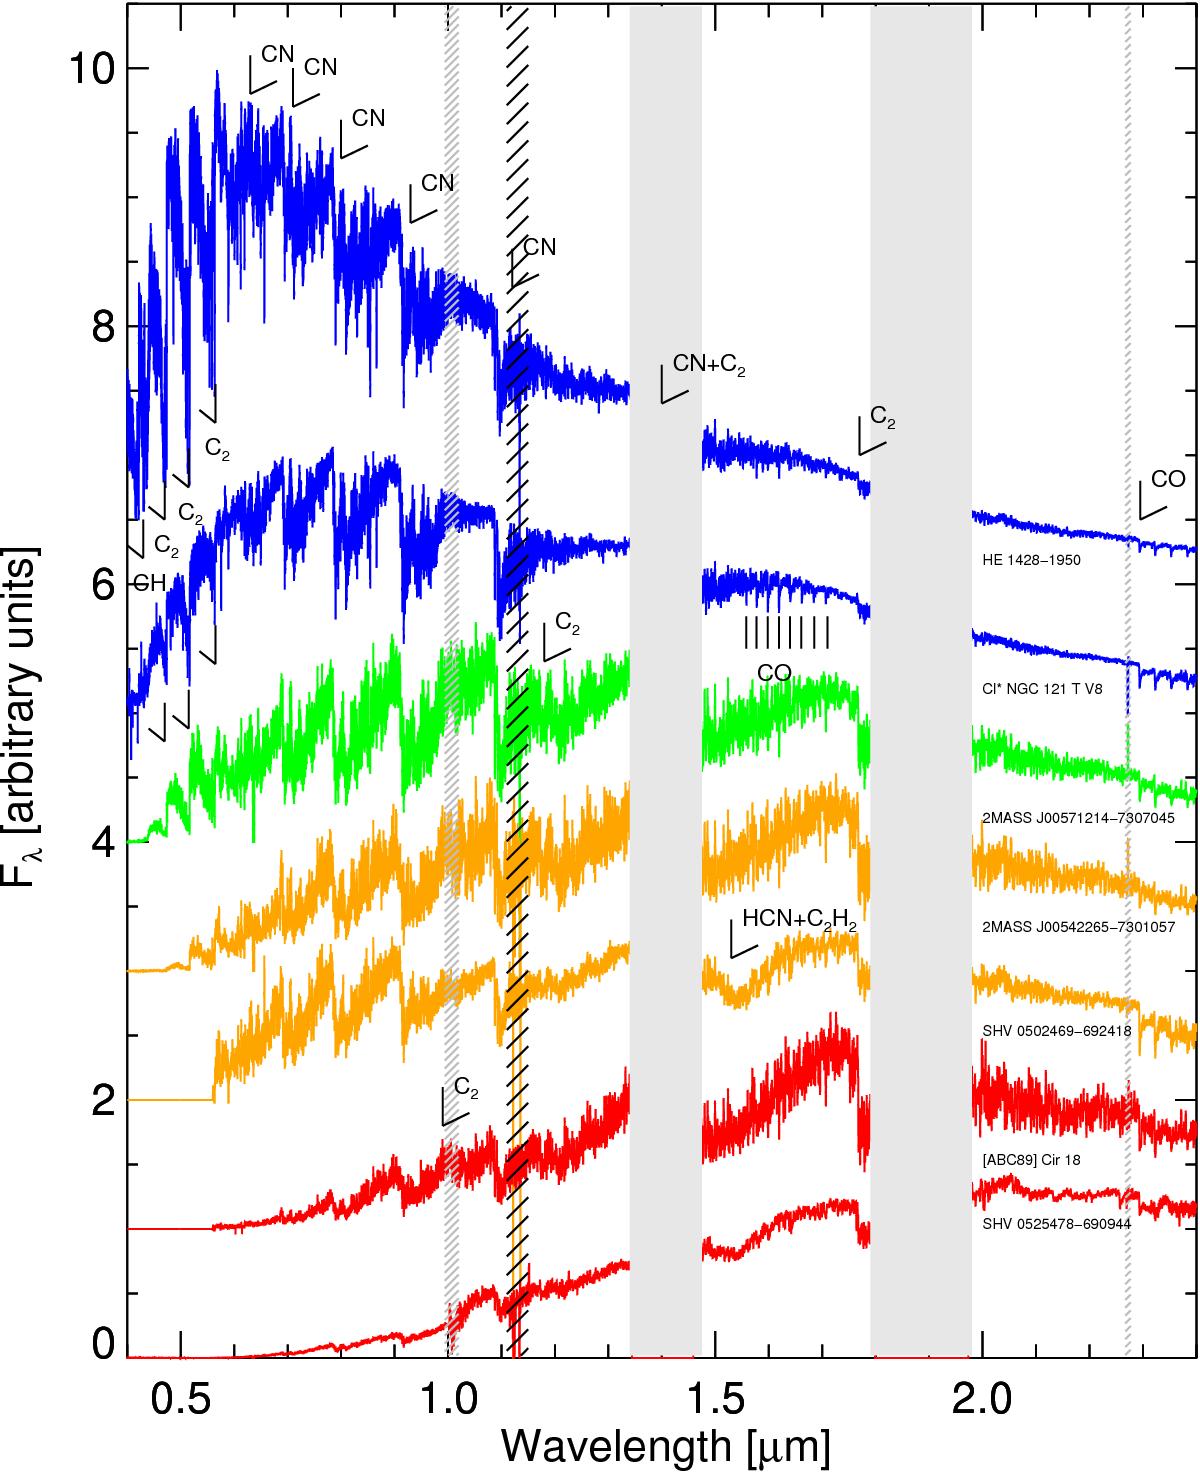
Representative spectra from our sample of carbon stars. The gray bands mask the regions where telluric absorption is strongest. The areas hatched in black are those that could not be corrected for telluric absorption in a satisfactory way. The areas hatched in gray are the merging regions between the VIS and NIR spectra and between the last two orders of the NIR spectrum. In some spectra, data are missing at 0.635 μm. The spectra have been smoothed for display purposes to R ~ 2000. The colors represent the different groups of carbon stars. Group 1 stars are shown in blue (from top to bottom: HE 1428-1950 and Cl* NGC 121 T V8), Group 2 in red (2MASS J00571214-7307045), Group 3 in orange (from top to bottom: 2MASS J00542265-7301057 and SHV 0502469-692418) and Group 4 in red (from top to bottom: [ABC89] Cir 18 and SHV 0525478-690944).
Current usage metrics show cumulative count of Article Views (full-text article views including HTML views, PDF and ePub downloads, according to the available data) and Abstracts Views on Vision4Press platform.
Data correspond to usage on the plateform after 2015. The current usage metrics is available 48-96 hours after online publication and is updated daily on week days.
Initial download of the metrics may take a while.