Fig. 3
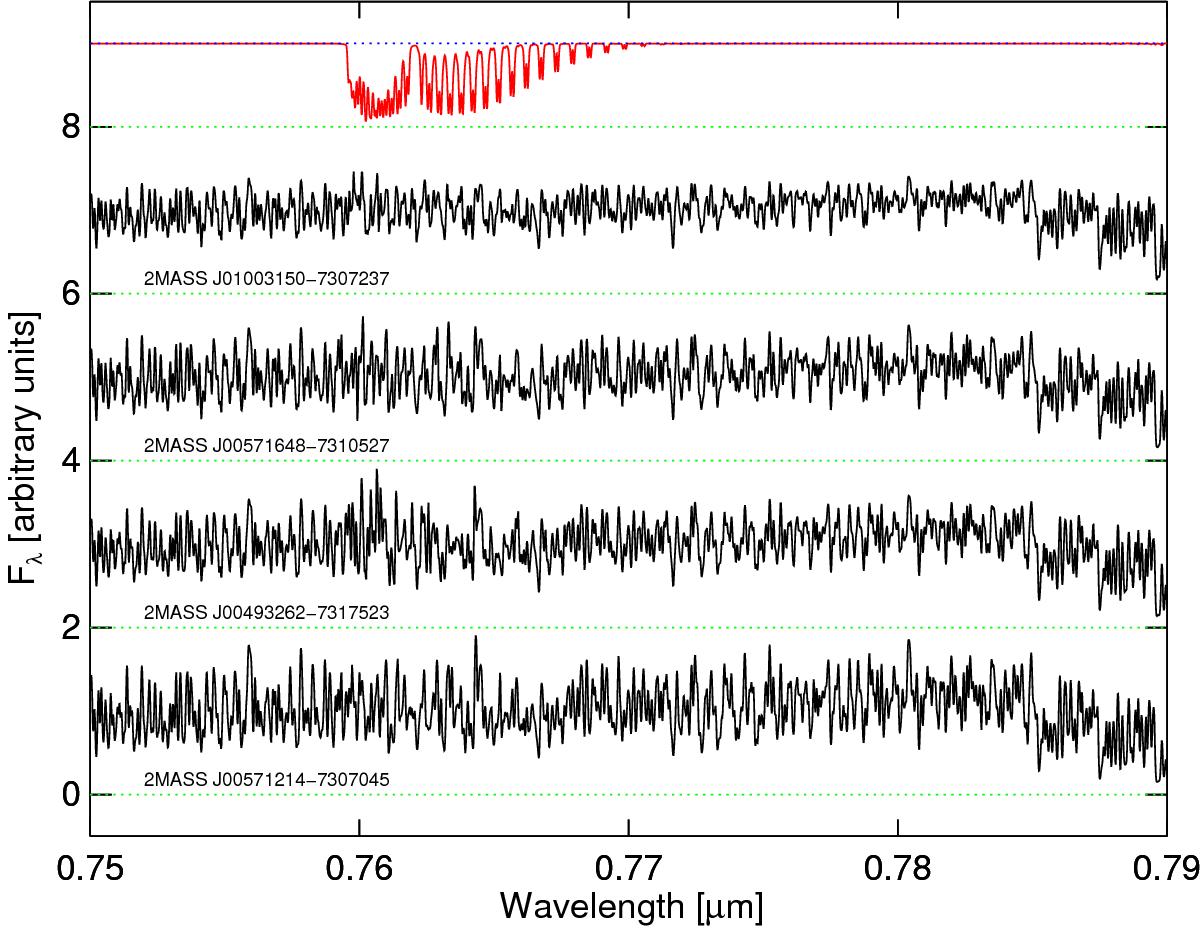
Illustrative spectra in the VIS wavelength range. The red spectrum is a telluric sky model, smoothed to R ~ 10 000. From top to bottom, the stars are 2MASS J01003150-7307237, 2MASS J00571648-7310527, 2MASS J00493262-7317523 and 2MASS J00571214-7307045. Offsets of 0, 2, 4, 6 and 8 flux units have been applied to the C-star spectra and the telluric spectrum for display.
Current usage metrics show cumulative count of Article Views (full-text article views including HTML views, PDF and ePub downloads, according to the available data) and Abstracts Views on Vision4Press platform.
Data correspond to usage on the plateform after 2015. The current usage metrics is available 48-96 hours after online publication and is updated daily on week days.
Initial download of the metrics may take a while.