Fig. A.2
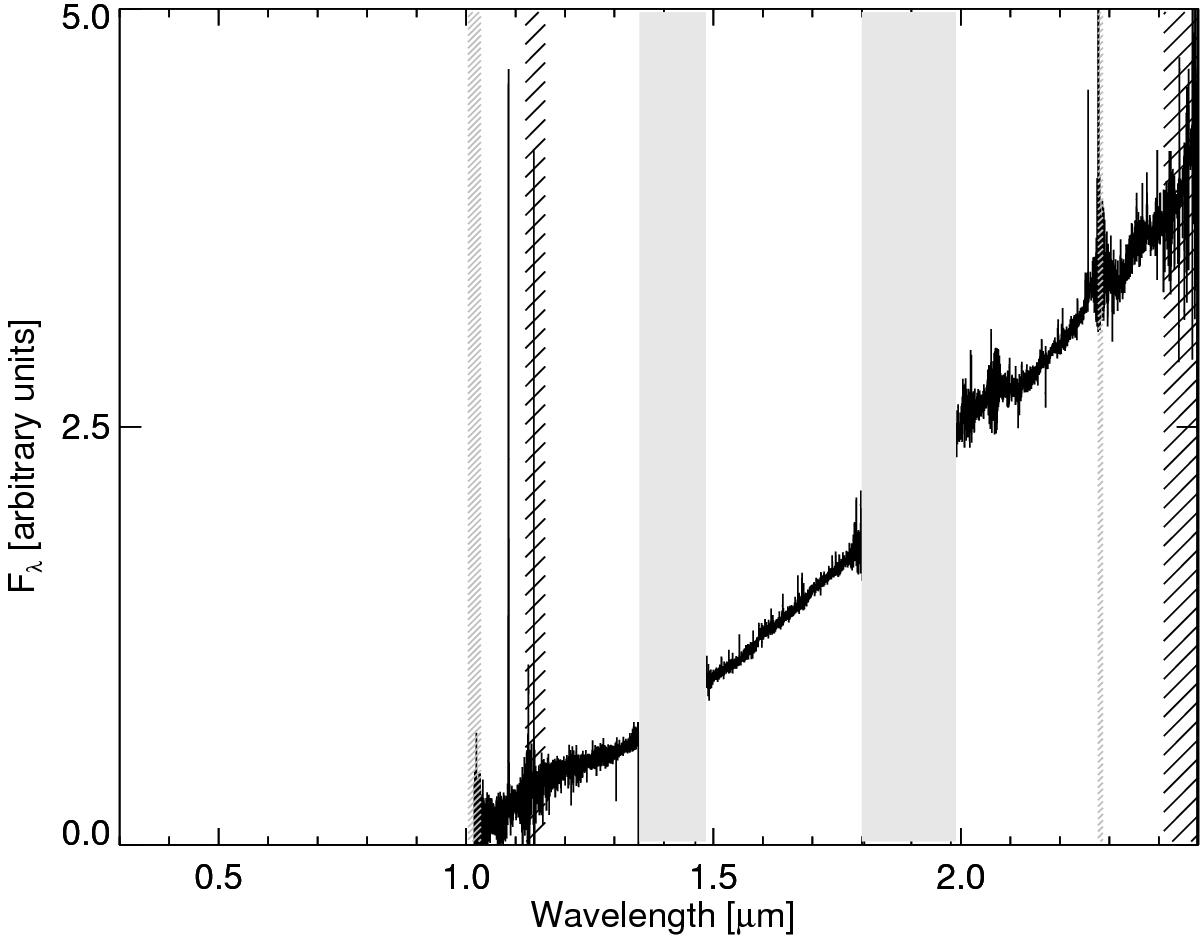
Spectrum of V CrA, from the UVB to NIR. The UVB and VIS parts of the spectrum are consistent with zero flux. The gray bands mask the regions where telluric absorption is strongest. The areas hatched in black are those that could not be corrected for telluric absorption in a satisfactory way. The area hatched in gray is the merging region between the last two orders of the NIR part.
Current usage metrics show cumulative count of Article Views (full-text article views including HTML views, PDF and ePub downloads, according to the available data) and Abstracts Views on Vision4Press platform.
Data correspond to usage on the plateform after 2015. The current usage metrics is available 48-96 hours after online publication and is updated daily on week days.
Initial download of the metrics may take a while.